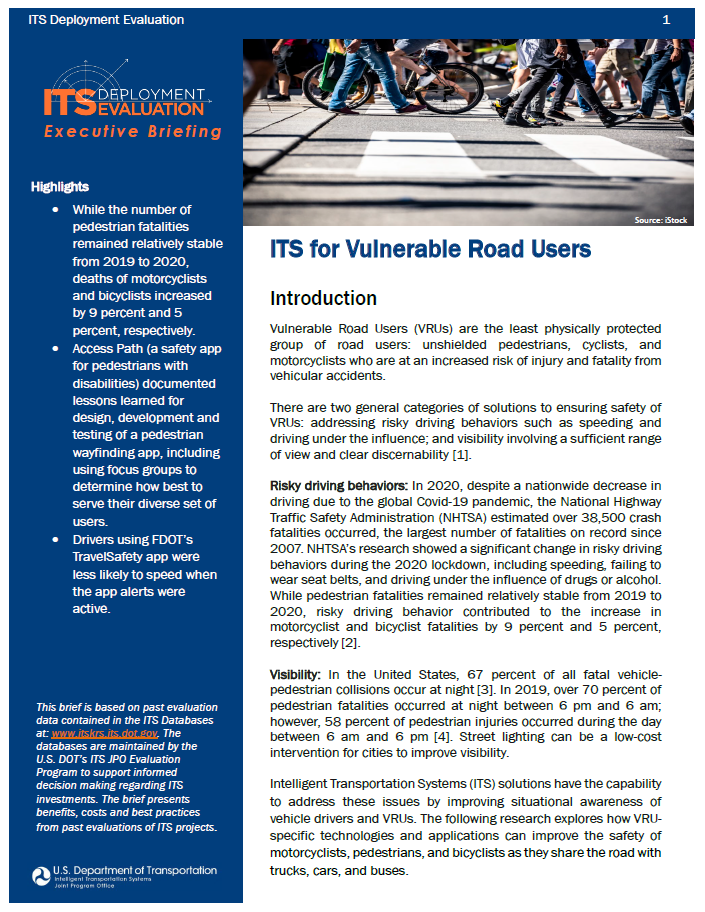
ITS for Vulnerable Road Users
2021 Executive Briefing
BRIEFING HIGHLIGHTS:
- While the number of pedestrian fatalities remained relatively stable from 2019 to 2020, deaths of motorcyclists and bicyclists increased by 9 percent and 5 percent, respectively.
- Access Path (a safety app for pedestrians with disabilities) documented lessons learned for design, development and testing of a pedestrian wayfinding app, including using focus groups to determine how best to serve their diverse set of users.
- Drivers using FDOT’s TravelSafety app were less likely to speed when the app alerts were active.
Introduction
Vulnerable Road Users (VRUs) are the least physically protected group of road users: unshielded pedestrians, cyclists, and motorcyclists who are at an increased risk of injury and fatality from vehicular accidents.
There are two general categories of solutions to ensuring safety of VRUs: addressing risky driving behaviors such as speeding and driving under the influence; and visibility involving a sufficient range of view and clear discernability [1].
Risky driving behaviors: In 2020, despite a nationwide decrease in driving due to the global Covid-19 pandemic, the National Highway Traffic Safety Administration (NHTSA) estimated over 38,500 crash fatalities occurred, the largest number of fatalities on record since 2007. NHTSA’s research showed a significant change in risky driving behaviors during the 2020 lockdown, including speeding, failing to wear seat belts, and driving under the influence of drugs or alcohol. While pedestrian fatalities remained relatively stable from 2019 to 2020, risky driving behavior contributed to the increase in motorcyclist and bicyclist fatalities by 9 percent and 5 percent, respectively [2].
Visibility: In the United States, 67 percent of all fatal vehicle-pedestrian collisions occur at night [3]. In 2019, over 70 percent of pedestrian fatalities occurred at night between 6 pm and 6 am; however, 58 percent of pedestrian injuries occurred during the day between 6 am and 6 pm [4]. Street lighting can be a low-cost intervention for cities to improve visibility.
Intelligent Transportation Systems (ITS) solutions have the capability to address these issues by improving situational awareness of vehicle drivers and VRUs. The following research explores how VRU-specific technologies and applications can improve the safety of motorcyclists, pedestrians, and bicyclists as they share the road with trucks, cars, and buses.
Benefits

Intelligent Transportation Systems (ITS) can protect VRUs by improving the safety of their surrounding traffic. Over the last decade, fatalities from bicycle transportation incidents have increased by 37 percent, while the number of preventable (nonfatal) injuries has declined by 40 percent [5]. In-vehicle solutions such as ITS for Collision Avoidance Systems (CAS) (e.g. automatic emergency braking, lane departure warnings, blind spot warnings, and pedestrian detections) have the potential to save over 11,000 lives per year when adopted fleet wide. (2020-01517). The following are other examples of ITS applications and installations that protect the safety of VRUs in several settings.
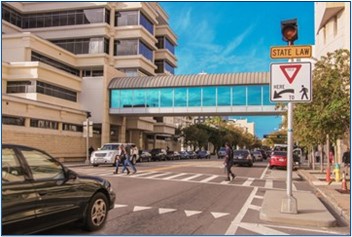
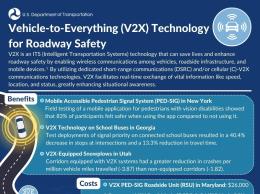
Pedestrian hybrid beacons (PHBs) support VRU safety on higher-speed roads. During April and May of 2018, over 1,000 pedestrians and bicyclists were observed and recorded at 186 different PHB locations, 56 signalized intersections, and 101 unsignalized intersections on higher-speed roads throughout Arizona (44- 54 mph). Overall, PHBs have shown high value in VRU safety, and pedestrian involved crashes were reduced by 46 percent.
Drivers yielded to pedestrians an average of 97 percent of the time at all sites; and yet, 59 percent rolled through the stop if the red light was flashing. (2021-01054).
There were several key takeaways from this research when it comes to pedestrian safety:
- The number of pedestrians and bicyclists using the push button was only 66 percent, as most rely on gaps in the traffic to cross.
- Arizona guidance states that PHBs should not be used on roads with a speed limit above 45 mph. Researchers recommend that PHBs be installed on streets up to 50 mph, and that the guidance be updated based on the safety analysis in the study.
- Researchers recommend some infrastructural changes in PHB placement and signage. For example, PHBs should be placed at least 300 feet from another controlled pedestrian crossing, and that their timing be synched if placed within 600 feet. The report also recommends signage noting drivers “stop here on red” and “stop here for pedestrians” to encourage drivers to yield at PHBs.
Roadside units (RSUs) at intersections can improve safety for bicyclists. The VRUITS project, led by the European Commission DG MOVE, was a series of small ITS research projects based in several European cities. One VRUITS project from 2015 took place in Helmond, Netherlands and assessed the impact of new ITS applications on the safety of cyclists. The study involved intelligent bicycles retrofitted with displays and vibrating handlebars, with two groups of cyclists – crash dummies and human volunteers. In these respective field tests, the reliability of the Cooperative Autonomous Emergency Braking (CAEB) was monitored. As bicycles approached the outfitted intersections, the RSUs sent Cooperative Intelligent Transport System (C-ITS) messages to the vehicles. If the bikes and vehicles were determined by the CAEB to be a high risk for a collision, the driver would be warned, and auto-brake would engage. This was a relatively successful system that consistently warned the driver when the time to collision (TTC) was estimated to be between 4 and 1.8 seconds. In the trials with volunteer cyclists, the RSU system correctly identified the cyclists’ paths with an 81 percent success rate (2018-01234).
After testing, questionnaires were distributed and gathered to gain insight on the user experience. The following are key insights from the questionnaires:
- Volunteer cyclists: A majority (60 percent) of the of respondents (strongly) agreed that the warnings of the CAEB system were effective in avoiding a critical collision with a vehicle. Additionally, 53 percent of respondents stated that they were willing to pay for this equipment for a bicycle.
- Volunteer co-drivers and passengers: Nearly all respondents (96 percent) (strongly) agreed that the probability of an accident was reduced by using this system. Similarly, 83 percent of respondents would want to have the system. However, less than half of the respondents (44 percent) trusted the system, despite being unclear on how it works technically.
| Of the findings, the Miami-Dade County research report noted that overall, reaction time improved by 13 percent for rear-end conflicts, and pedestrian conflicts saw a 26 percent improvement, with drivers yielding more frequently. |
ITS technology installed on public transportation can support VRU safety. Florida Department of Transportation (FDOT) and the Miami-Dade County Public Works Department researched pedestrian CAS technology and developed a benefit-cost analysis for the following scenarios: installing the advanced collision avoidance system on two high-risk bus routes (119 and 120) and installing the system on all county buses. Based on the results, researchers used the reduction in number of crashes from each scenario multiplied by the dollar value of crashes (determined by a literature review) to yield the annual benefit, which was then multiplied by a seven percent interest rate. Using the system on Route 119 and 120 produced a benefit-cost ratio of 1.86 and 1.24, respectively. The weakest benefit-cost ratio, 0.60, was for the all-route implementation. The report concluded that CAS technology would be cost-effective if installed on buses serving routes with high-crash frequencies, but not if installed on the entire Miami-Dade County fleet (2020-00994).
Costs
With a broad range of ITS technologies and applications that protect vulnerable road users, the costs associated with implementing these technologies and applications vary greatly. Infrastructural costs can be more expensive overall but are integral for protecting VRUs. ITS technology for vehicles may be less costly, but in many cases have a smaller footprint when it comes to building a safer environment for VRUs.
Infrastructural ITS can support many different technology applications. For example, RSUs equipped with dedicated short-range communication (DSRC) equipment or Cellular Vehicle-to-Everything (C-V2X) technology that utilizes the cellular network can facilitate a range of connected device ITS applications. Pedestrian Presence Alerts (PPA) specifically aim to support pedestrian safety efforts by providing drivers with a warning about nearby pedestrian activity through a mobile application. In Gwinnett County, Georgia, for example, the price tag was estimated at $309,000 for 20 intersections (2020-00468). In certain cases, infrastructure investments that protect VRUs can pay for their operation in revenue. For example, a school zone speed camera program implemented in New York City cost $155,779,314 in operating and $94,588,548 in capital costs from 2014 through 2020, and the program received $134,880,223 in net revenue (2021-00485).
ITS for pedestrian safety can also be installed on vehicles to determine and target problem areas. New York City and London tested an advanced collision avoidance system specifically designed for municipal vehicles on their bus networks. The camera system uses up to four individual sensors for improved blind spot detection in urban environments. The toll tag-sized sensor can be mounted on the vehicle’s windshield, and a separate display hooks on to the driver’s dashboard [6]. The system costs about $6,900 per bus and $2,000 to install, and alerts drivers to blind spot detection, forward collision warnings, pedestrian and cyclist collision warnings, lane departure warnings, headway monitoring, and speed indicators. Industry partners are working to collect and visualize data that can show where pedestrians and cyclists are most at risk, and where informed transportation planning decisions can be made (2020-00994).
Best Practices
The USDOT has prioritized research and supporting emerging technology that improves VRU safety. The following are best practices and lessons learned that come from the USDOT funded research and deployments that aim to understand the impact of ITS for VRUs.
Crowdsourced data can help ITS scale quickly to better assist VRUs who experience additional barriers to navigating roads and sidewalks safely, such as wheelchair users, among others. AccessPath is an ITS wayfinding application developed by pathVU, a Pittsburgh-based startup, with funding from the USDOT’s Accessible Transportation Technology Research Initiative (ATTRI). The organization’s co-founders researched the effects of sidewalk conditions on wheelchair user comfort and developed an international standard regarding the measurement of sidewalk roughness. Pedestrians with disabilities have additional barriers when it comes to navigating roads and sidewalks safely and are considered especially at risk VRUs. Apps like AccessPath offer opportunities to improve mobility by and for the disability community. As a part of this project, crowdsourced data can increase pedestrian users’ understanding of their surrounding environment by alerting them. The app also helps users in pre-trip planning as well as real-time navigations, offering voiceover and talkback compatibility. Through targeted focus groups and surveys, the app was built to identify sidewalk conditions such as tripping hazards, roughness, running slope, cross slope, and more. The app’s dataset includes 60 miles of sidewalk in Pittsburgh, Pennsylvania; 50 miles of sidewalk in Washington, DC; and 50 miles of sidewalk in Portland, Oregon. The former two were collected via a physical sidewalk profiling tool, and the latter’s pathway data was collected via satellite (2021-01030).
Pedestrian safety applications involving smartphone technology need reliable Global Positioning System (GPS) accuracy to be successful. Three connected vehicle (CV) pilot programs were jointly funded by the US Department of Transportation (USDOT) in 2015 to explore CV applications and technologies to address certain needs within their unique transportation networks. The Tampa Hillsborough Expressway Authority (THEA) CV Pilot program uncovered some technical deployment issues in relationship to the technical success of pedestrian safety applications tested. The study found that GPS technology as of 2020, was still insufficient to accurately maintain GPS location and sometimes unable connect to WIFI because of public WIFI access spots. The CV pilot team pivoted from GPS/smartphone connected infrastructure to rely on LIDAR unite that provided more reliable data. However, after several months of success, one of the two LIDAR units installed failed, and both LIDAR units were replaced by thermal sensor cameras to ensure the pedestrian safety requirements were met [7]. Overall, the reliability of smartphone technology to provide safety assistance to users via DSRC technology was limited, resulting in the removal of several means of testing pedestrian safety outcomes during the THEA CV Pilot program (2021-01027).
Case Study
The following case study focuses on how ITS safety improvements, alongside planning and legislative interventions, created an environment that protects some of the most vulnerable road users - children.
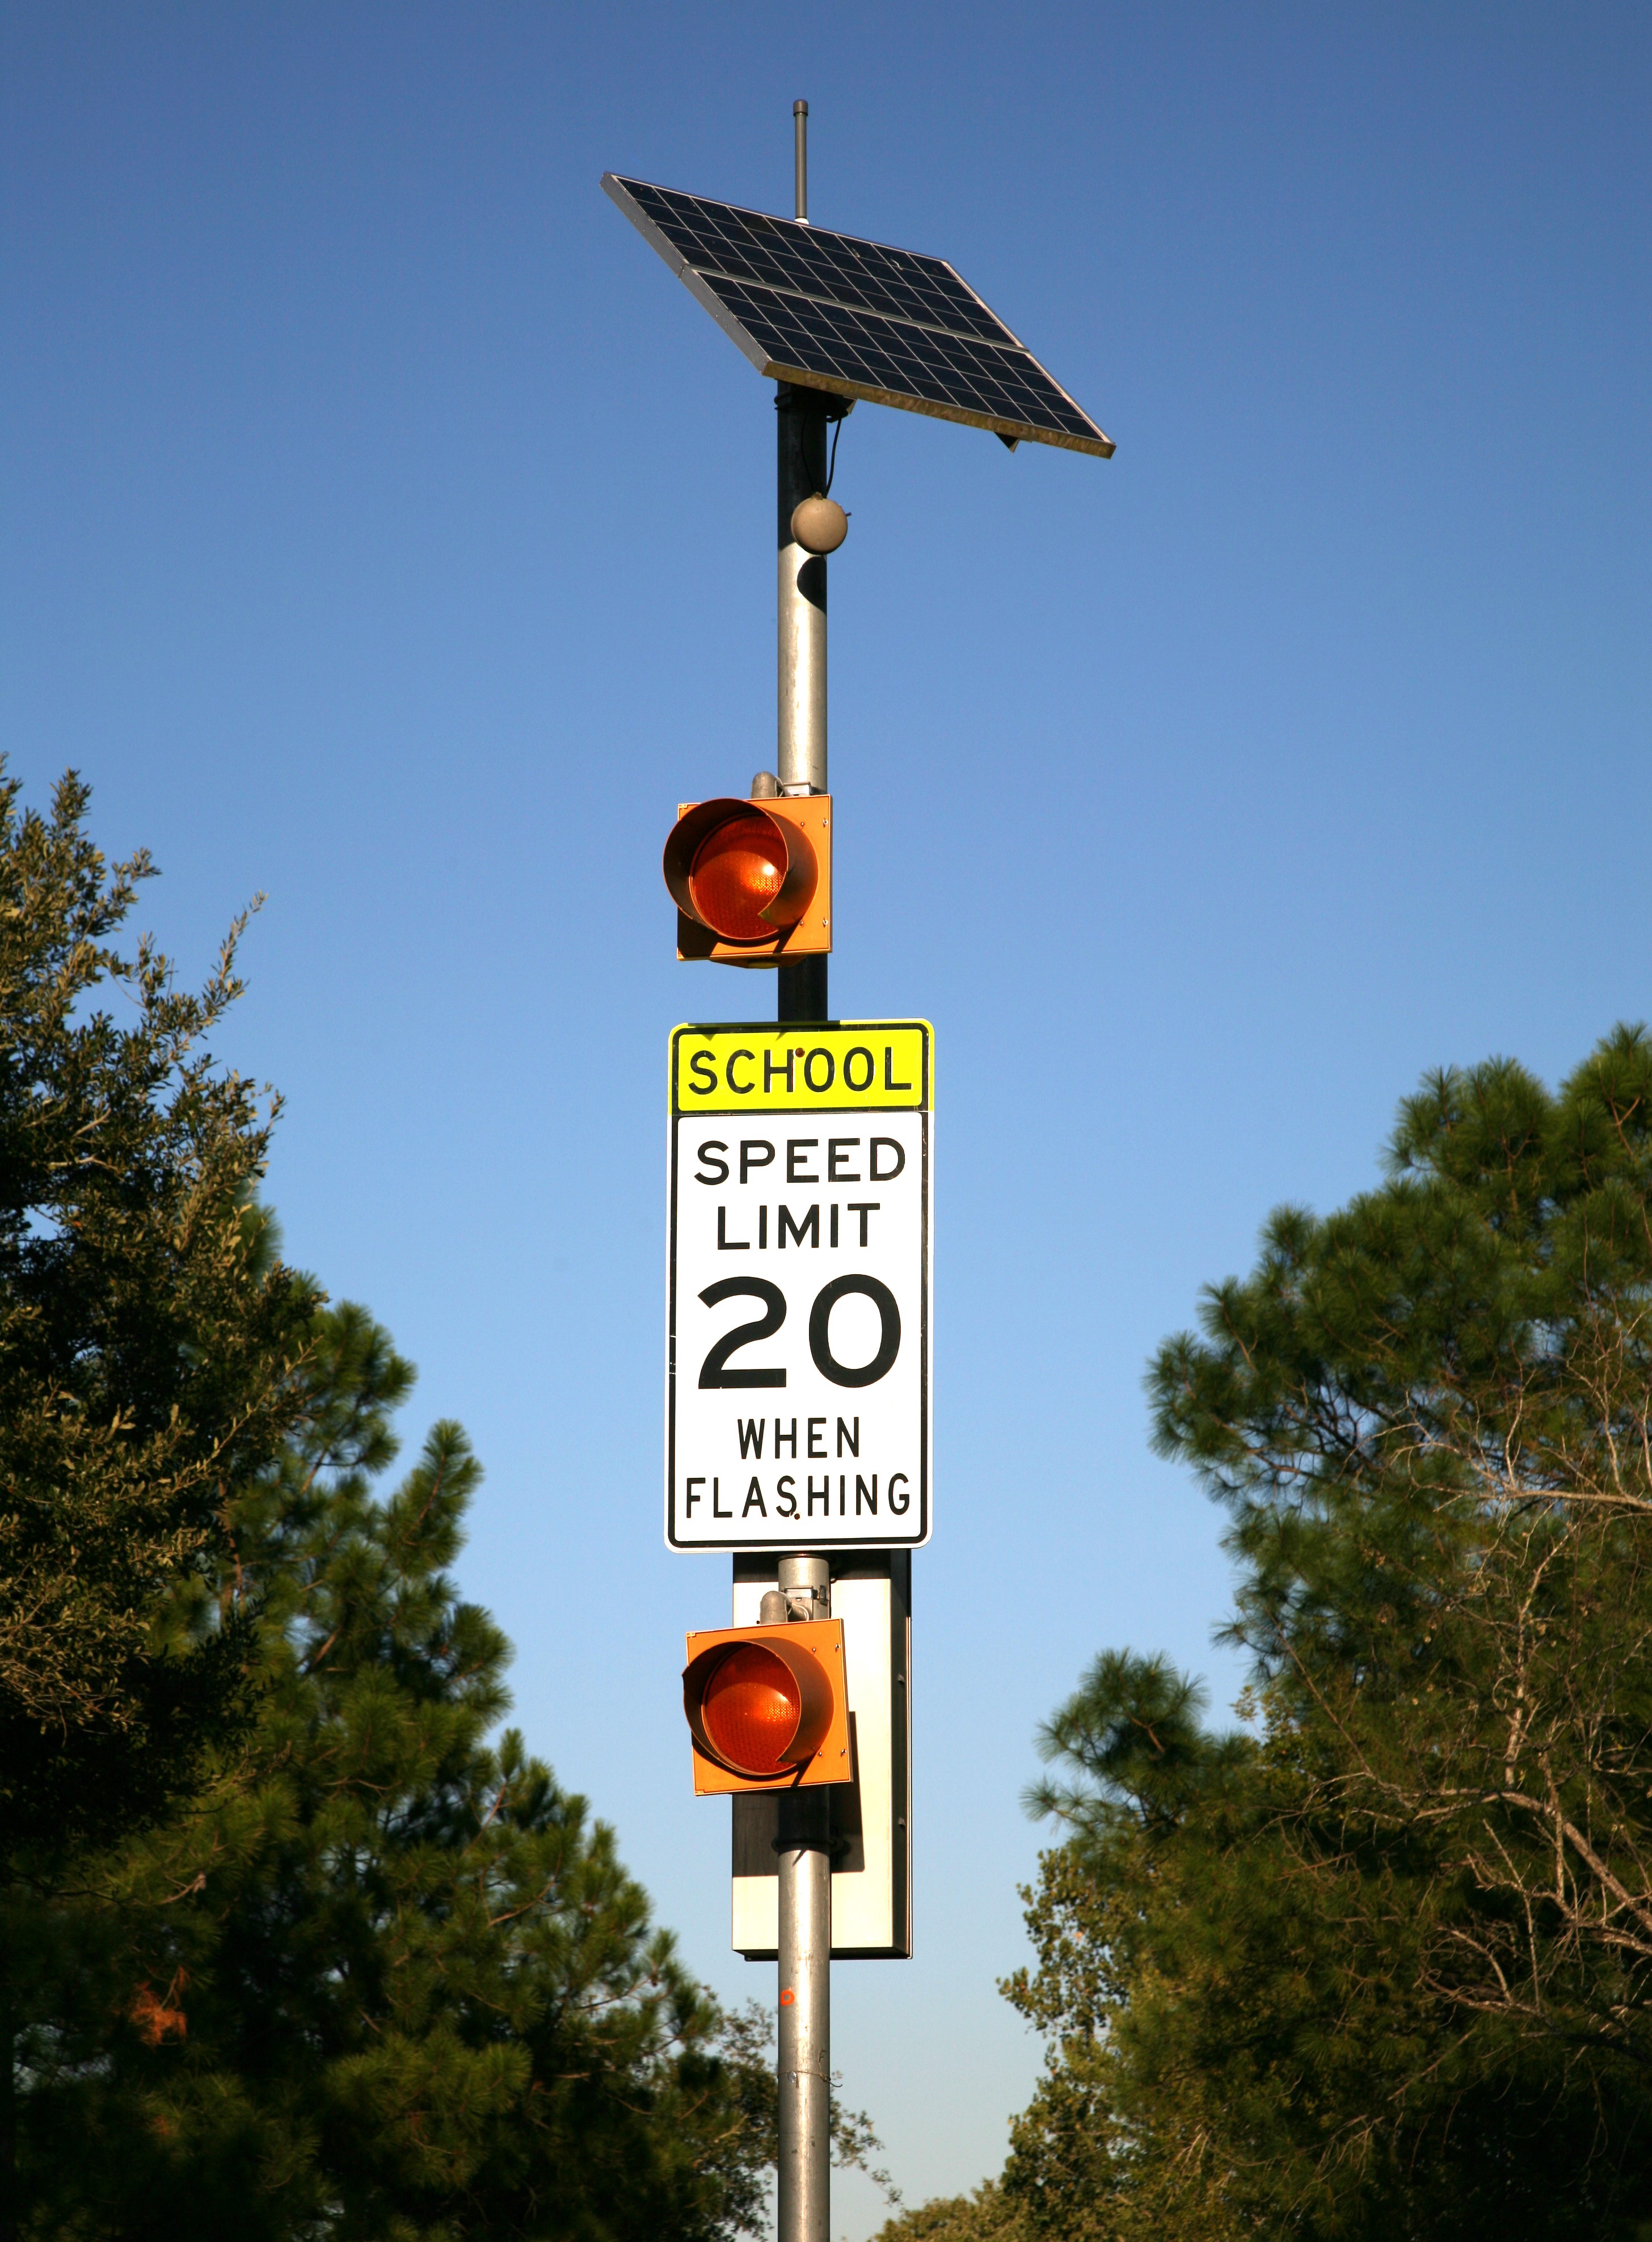
In 2017, the State of Florida added language in the “Manual on Speed Zoning for Highways, Roads, and Streets in Florida” that requires mandatory installation of flashing beacons within reduced speed school zones. A 2009 study showed that one in six drivers were distracted while driving in a school zone. Since then, flashing beacons have been regarded as a proactive measure to alert drivers to school and reduce distracted driving in school zones.
An FDOT study that took place from March to May of 2019 tested the use of the TravelSafety app to alert drivers who speed while in an active school zone. In addition to the mandatory flashing beacon lights, the piloted beacon infrastructure notifies smartphone service providers of the active or inactive status of the school zone and provides drivers with alerts if they exceed 20 mph in a school zone. In testing, drivers were randomly assigned to one of three conditions: no alerts, audio alerts, and audio/visual alerts. As referenced in Table 1, in all four school zones tested over the three-month period, drivers were less likely to speed when the app alerts were active.
| Condition | Zone 1 | Zone 2 | Zone 3 | Zone 4 |
|---|---|---|---|---|
| Stealth/Off | 36% | 6.06% | 36% | 14% |
| Audio On | 23% | 4.6% | 13.4% | 11% |
| Audio/Visual On | 23% | 1.1% | 1% | 6.4% |
There were several other outcomes from this research. Notably, drivers became generally more likely to visually scan the road after using the app, building more habits in situational awareness through its use. Additionally, the app was also able to drivers to bicyclists both in and outside of school zones who had downloaded the app (and kept it open while biking). During their first drip, drivers were more cognizant of the app notifications for bicyclists; and as they became familiar with the routes, the likelihood of reduction in speed became slimmer. Researchers noted that the visual alert could be drawing the drivers’ attention to the cell phone instead of the cyclist. In addition to the benefits of using the TravelSafety app in school zones, several positive behavioral changes were beginning as of its initial testing (2021-01532).
References
[1] A. Constant and E. Lagarde, “Protecting Vulnerable Road Users from Injury,” PLoS Med, vol. 7, no. 3, p. e1000228, Mar. 2010, doi: 10.1371/journal.pmed.1000228.
[2] D. Kaplan, “How Intel’s Mobileye And Esri Plan To Make Smart Cities Into ‘Safer Cities’ For Transportation -,” Dec. 04, 2017. https://geomarketing.com/how-intels-mobileye-and-esri-plan-to-makesmart-cities-into-safer-cities-for-transportation (accessed Dec. 21, 2021).
[3] National Highway Traffic Safety Administration, “2020 Fatality Data Show Increased Traffic Fatalities During Pandemic | NHTSA,” Jun. 03, 2021. https://www.nhtsa.gov/press-releases/2020-fatality-datashow-increased-traffic-fatalities-during-pandemic (accessed Dec. 21, 2021).
[4] “Bicycle Deaths,” National Safety Council Injury Facts, 2019. https://injuryfacts.nsc.org/home-andcommunity/safety-topics/bicycle-deaths/ (accessed Dec. 21, 2021).
[5] “Traffic Safety Facts: 2007 Data Pedestrians.” National Highway Traffic Safety Administration, 2007. [Online]. Available: https://crashstats.nhtsa.dot.gov/Api/Public/ViewPublication/810994.
[6] “Tampa (THEA) Connected Vehicle Pilots Works with the Infrastructure Integrator to improve Vehicle to Infrastructure (V2I) Connected Vehicle (CV) Applications,” Intelligent Transportation Systems Joint Program Office, Nov. 2020. https://www.its.dot.gov/pilots/thea_v2i_cv.htm (accessed Dec. 21, 2021).
[7] “Traffic Safety Facts 2019: A Compilation of Motor Vehicle Crash Data,” National Highway Traffic Safety Administration, DOT HS 813 141, Aug. 2021. [Online]. Available: https://crashstats.nhtsa.dot.gov/Api/Public/ViewPublication/813141.