2023 Executive Briefing
BRIEFING HIGHLIGHTS
- Bus Rapid Transit (BRT) ITS technologies were found to decrease wait times by 63 percent and reduce peak hour delays by 13 percent.
- Recent Real Time Transit Information (RTI) displays and installations costed as little as $3,590 per device.
- The Cleveland RTA Health Line BRT both increased ridership along its corridor by 80 percent from 2008-2013 and produced $9.5 billion in economic benefits during its first decade of operation.
Introduction
The COVID-19 pandemic led to a historic decline in transit ridership. Public transit ridership declined by nearly 80 percent in April 2020, shortly after the pandemic’s onset [1]. However, even before the pandemic there was a decades-long trend of transit ridership decline. From 2012 to 2018, bus ridership declined 15 percent, much higher than the 3 percent decline registered for rail ridership [2].
Bus Rapid Transit (BRT) services, by contrast, have often shown increased ridership along the routes where they are implemented and provide more attractive services for riders. A 2017 study done by the University of Washington found that Ridership increased by 35 percent along routes where BRT was implemented compared to routes that maintained conventional bus service [3].
According to the Federal Transit Administration (FTA), BRT “is a high-quality bus-based transit system that delivers fast and efficient service that may include dedicated lanes, busways, traffic signal priority, off-board fare collection, elevated platforms and enhanced stations [4].” BRT is often contrasted from traditional bus service by the technologies that it utilizes. The FTA has identified a series of features it considers as elements of BRT. One of these features, state-of-the-art technologies, is made up of Intelligent Transportation Systems (ITS) components [5].
Some of these ITS components are listed below in Table 1. While these components are not exclusive to BRT, they are often found integrated into BRT implementation.
| Technology | Description |
|---|---|
| Automated Scheduling and Dispatch Systems | Automated Scheduling and Dispatch systems for transit usually consist of Computer Aided Dispatch, or CAD. CAD is software that incorporates transit routes, schedules, trip orders and vehicle assignments to provide dispatchers with locations of vehicles to dispatch trip requests more efficiently, to maintain better service, and to respond to disruptions such as disabled vehicles [6]. |
| Electronic Fare Payment | Electronic Fare Payment is a non-cash, technology-based system of fare collection such as contactless smart cards or mobile ticketing [7]. |
| Real Time Transit Information (RTI) | Real Time Transit Information consists of automatic vehicle location (AVL) and/or real-time passenger information (RTPI) provided by vehicle mounted sensors. This information is transmitted to a central database [8]. |
| Transit Signal Priority (TSP) | Transit Signal Priority, or TSP, modifies traffic signal timing or phasing when transit vehicles are present, with the potential to improve both reliability and travel time [9]. |
There are several programs that the U.S. DOT has sponsored to promote adoption of these technologies. For example, the Federal Transit Administration (FTA) Enhancing Mobility Innovation program “promotes technology projects that center the passenger experience and encourage people to get on board, such as integrated fare payment systems and user-friendly software for demand-response public transportation [10].” The program recently entered into cooperative agreements with nine transit agencies in 2022, and several of these awardees focus on ITS-related technologies, such as Plano, Texas’ proposed installation of RTI displays. Other grant programs centered around technology adoption sponsored by the FTA include the Accelerating Innovative Mobility and Integrated Mobility Innovation programs.
Benefits
Benefits for BRT include greater predictability, decreases in wait times for the passenger, and better transit management and cost savings for transit agencies. ITS technologies play a role because they are harnessed to create BRT services and provide many of the benefits.
Automated Scheduling and Dispatch Systems were found to decrease wait times and increase the predictability of service; enhancements that are often goals of BRT. In Contra Costa County, CA, an integrated dynamic transit operation system was piloted by Tri-Delta Transit and San Francisco Bay Area Rapid Transit (BART) to help connect transit points and hold connections for incoming passengers. The system was able to decrease connecting passengers’ average waiting time by 24 minutes for Tri Delta Transit bus-to-bus connections and by 31 minutes for connections between BART and Tri Delta Transit buses (2021-B01613). In Pittsburgh, the Port Authority of Allegheny County (PAAC) used automatic passenger counters (APC) and AVL systems to understand the actual working conditions of a particular bus route, and were able to use that new information to design a schedule that was able to improve bus schedule adherence for that route by 20 percent (2020-B01442).
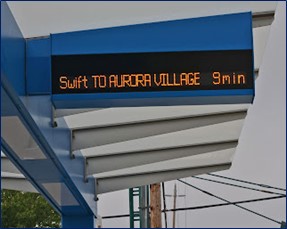
The benefits of RTI systems can be seen most clearly with decreasing wait times for customers, increasing customer satisfaction. A test of a multimodal real-time transit information mobile application on Mountain Line Transit West Virginia found that those who used the application waited on average almost 3 minutes less than those who did not, producing a 63 percent decrease in wait time (2022-B01646). Both trip time reduction as well as dissemination of knowledge could contribute to higher rates of customer satisfaction. According to a study done by Arlington County, Virginia that investigated travelers perceptions of RTI, riders’ satisfaction with real-time technologies was close-to or over 80 percent for all options except the phone number option, with over 93 percent of users satisfied with real time transit screen displays (2020-B01516). Increasing satisfaction and knowledge among riders could translate into higher ridership potential.
TSP has shown to produce marked improvements in timing, reducing delays of buses. A simulation study in Salt Lake City implementing GPS-based transit signal priority strategies reduced peak hour transit delays by 13 percent and yielded a 9 percent savings in peak hour transit times (2019-B01347). A similar finding was seen in Orlando, where simulation studies were estimated to reduce delays up to 64 percent for buses; furthermore, the greatest delay reductions were noted when general BRT improvements were implemented along with TSP (2017-B01153). Derivatives of TSP have also shown promise in reducing fuel consumption. In Virginia, a scenario showed that a green light optimal speed advisory system for buses, which advises bus drivers the optimal speed to obtain a green light, was estimated to reduce fuel consumption by 22.1 percent (2022-B01654).
Costs
Costs for ITS BRT components can vary widely, as components range in technological complexity and widespread applicability.
Automated Scheduling and Dispatch Systems used by transit agencies are often composed of both CAD and AVL. Many of the more recent implementations of CAD and AVL have been to replace legacy systems that have grown obsolete. In Tampa in 2020, Hillsborough Area Regional Transit (HART) found that the cost to replace an outdated CAD/AVL system to support a fleet of 200 vehicles was estimated at $9.8 million (2020- SC00451). This works out to about $49,000 per-vehicle. Meanwhile, in California, in 2015 the Alameda-Contra Costa Transit District paid about $21 million deploying a new CAD/AVL and voice communication system to replace its outdated 1999 system (2016-SC00368).
RTI often covers real-time display signs and apps. When deploying real-time signs in 2021, King County Metro paid between $3,590 and $17,810 per-display, with the variability in costs dependent on whether the displays used solar or ground power, with larger displays also needing mounting brackets (2023-SC00541). King County Metro is in the process of deploying over 340 of the signs from 2021-2026. The first 15 are already installed as of 2021.
| TSP costs are often bundled with connected vehicle Vehicle-to-Infrastructure (V2I) technology implementations. |
Many of the TSP costs are bundled with the implementation of Vehicle-to-Infrastructure (V2I), technology. Overall costs can range depending on how widely TSP is implemented in a jurisdiction, as multiple intersections along a corridor are often equipped to handle TSP rather than one-off intersections. In 2020, the Utah Department of Transportation deployed a Dedicated Short-Range Communications (DSRC) system supporting transit signal priority controls along an entire corridor for a total cost of $575,900 (2021- SC00495). TSP was installed at 24 intersections along the corridor at $24,000 per-intersection. Later, Utah DOT also field tested both CV2X and DSRC to gauge the range of reception of devices, with tests being conducted in October 2020 [11]. In 2019, Gwinnett County, Georgia, estimated that applying DSRC that included Transit Signal Priority to 20 identified intersections in the county would cost a total of $309,000 (2020-SC00468). This worked out to be about $15,450 per-intersection.
Best Practices
Some best practices have been identified when implementing ITS components that could be used for BRT. One lesson when implementing Automated Scheduling and Dispatch Systems is making sure everyone has reliable access to the information to sufficiently act on it when transmitted. When implementing an Integrated Dynamic Transit Operation (IDTO), Tri-Delta Transit (TDT) and Bay Area Rapid Transit (BART) found that the lack of onboard driver information could cause issues with overloading dispatch operators, and that transit operators having access to that would be critical as operations using IDTO increase (2021-L01077).
When considering RTI, it is important to recognize that its accuracy is very important to how beneficial it is for riders. A study conducted in Arlington County, Virginia found that over 65 percent of survey respondents checked RTI before leaving home, while findings from the focus group suggested that travelers would stop seeking out RTI if they found it to be inaccurate (2020-L01003).
Lastly, some important lessons go beyond ITS directly but are crucial to developing successful BRT systems and encouraging agency adoption.
In 2013, the city of Fresno, California hosted a peer exchange where transit agencies from California, Ohio, Oregon and Washington State came together to share best practices on their BRT implementations so Fresno could learn as it was developing its first BRT system. Lane County, Oregon found that even though the BRT service cost more to operate than traditional bus service, it attracted twice the number of riders, with a savings of 5 cents-per-passenger mile to operate over a traditional bus (2023-L01199).
| Metric | Bus | BRT | Savings |
|---|---|---|---|
| Cost per vehicle mile | $9.99 | $13.21 | ($3.22) |
| Cost per passenger mile | $0.78 | $0.73 | $0.05 |
| Cost per unlinked passenger trip | $3.19 | $1.91 | $1.28 |
| Cost per revenue hour | $130.27 | $155.42 | ($25.15) |
At the peer exchange in Fresno, the transit agencies also agreed that it was important to make sure that stakeholders are engaged and informed in the process to implement a BRT service. In particular, they recommended certain strategies such as:
- Conducting targeted outreach to business owners along the proposed BRT corridors to make sure they were aware of construction and the potential impacts to their businesses.
- Maintaining lines of communication between the general public and the status of the project so that people are not left in the dark and frustrated with the process.
- Being sensitive to language barriers and misinterpretations of terms.
- Showcasing vehicle and station prototypes to get the general public excited about the service (2023-L01198).
Success Story
Cleveland’s Health Line BRT

As one of the first BRT systems of its kind in the United States, Cleveland’s Health Line BRT is notable for its uses of BRT concepts such as dedicated right of way, its benefits on decreasing travel time and increasing ridership, and its positive economic and societal impacts on the surrounding community. The line has received a number of accolades over the years, including “Best Rapid Transit Bus Line” by the Institute for Transport and Development Policy in 2013, and as a “Gamechanger” for rapid transit by the American Society of Civil Engineers (ASCE) in 2017 [12].
In 2008, the City of Cleveland opened the BRT line along Euclid Avenue to connect Downtown Cleveland to the Cleveland Clinic and universities, replacing a traditional bus service along a similar route. The Health Line was built using many of the BRT technology best practices described by the FTA, such as off-board fare collection, more frequent and larger capacity transit vehicles, and dedicated right-of-way, and features ITS technologies such as traffic signal prioritization and real-time information displays [12].
As a result of BRT improvements, travel time along the route decreased considerably, from 40 to 28 minutes end to end. [13]. These time improvements, along with things like RTI displays, likely played a role in increasing ridership along the corridor. Before implementation of the BRT there were about 9,000 daily riders; by 2013 it was serving 16,000 daily riders, an increase of almost 80 percent [14]. The Health Line also had other positive impacts on the surrounding community through increased economic vitality. A 2017 study found that since the BRT been implemented in 2008, the number of jobs had doubled in communities along the line [15]. In 2018, locals estimated that the line had produced over $9.5 billion in economic development along the corridor during the 10 years it had been in operation [13].
References
- APTA, “The Impact of the COVID-19 Pandemic on Public Transit Funding Needs in the U.S,” Jan. 2021. https://www.apta.com/wp-content/uploads/APTA-COVID-19-Funding-Impact-2021-01-27.pdf.
- G. D. Erhardt, J. M. Hoque, V. Goyal, S. Berrebi, C. Brakewood, and K. E. Watkins, “Why has public transit ridership declined in the United States?,” Transportation Research Part A: Policy and Practice, vol. 161, pp. 68–87, Jul. 2022. doi: https://doi.org/10.1016/j.tra.2022.04.006
- O. Stewart, A. Vernez Moudon, and B. Saelens, “The Causal Effect of Bus Rapid Transit on Changes in Transit Ridership,” Journal of Public Transportation, vol. 20, no. 1, pp. 91–103, Mar. 2017. doi: https://digitalcommons.usf.edu/jpt/vol20/iss1/5/
- FTA, “Bus Rapid Transit,” Dec. 09, 2015. https://www.transit.dot.gov/research-innovation/bus-rapid-transit (accessed Sep. 8, 2023).
- FTA, “Bus Rapid Transit—Elements, Performance, Benefits.” https://www.transit.dot.gov/sites/fta.dot.gov/files/BRTBrochure.pdf
- FTA, “Family of Transportation Services,” Nov. 2007. https://www.transit.dot.gov/sites/fta.dot.gov/files/docs/resources/166/fts-brochure.pdf
- N-CATT, “Fare Background: Systems, Payments, and Policies,” Nov. 08, 2022. https://n-catt.org/guidebooks/new-farepayment-systems-and-payment-technology/fare-background-systems-payments-and-policies/ (accessed Sep. 11, 2023).
- MobilityData, “Real-time transit information (RTI).” https://realtimetransit.info/ (accessed Sep. 11, 2023).
- NACTO, “Active Transit Signal Priority.” Apr. 19, 2016. https://nacto.org/publication/transit-street-designguide/intersections/signals-operations/active-transit-signalpriority/#:~:text=Transit%20Signal%20Priority%20%28TSP%29%20tools%20modify%20traffic%20signal (accessed Sep. 8, 2023).
- FTA, “Enhancing Mobility Innovation.” https://www.transit.dot.gov/research-innovation/enhancing-mobility-innovation (accessed Sep. 8, 2023).
- Z. Zhong, L. Cordova, M. Halverson, B. Leonard. “Field Tests on DSRC and CV2X Range of Reception on Utah Roadways.” Panasonic Corporation, Utah Department of Transportation. April 2021. https://transportationtechnology.utah.gov/wpcontent/uploads/2023/01/UDOT.Range-of-Reception-DSRC-C-V2X-Report-FINAL-2.pdf (accessed Jan. 4, 2024).
- Greater Cleveland RTA, “RTA’s HealthLine -- the world-class standard for BRT service | rideRTA.com.” https://www.riderta.com/healthline/about (accessed Sep. 11, 2023).
- G. Segall, “RTA says HealthLine had 10-year payback of $9.5 billion, ‘woke up’ Euclid Corridor,” The Plain Dealer, Nov. 04, 2018. https://www.cleveland.com/news/erry-2018/11/149927818e3851/rta-says-healthline-had-10year.html
- NACTO, “Euclid Avenue BRT, Cleveland, OH.” Jun. 15, 2015. https://nacto.org/case-study/euclid-avenue-brt-cleveland-oh/#:~:text=Bus%20ridership%20on%20Euclid%20Avenue%20has%20increased%20from (accessed Sep. 11, 2023).
- R. Piiparinen and J. Russell, “Center for Population Dynamics Quarterly Brief January 2017: Transportation’s Role in the Economic Restructuring of Cleveland,” Maxine Goodman Levin College of Urban Affairs, Cleveland State University, Jan. 2017. https://engagedscholarship.csuohio.edu/cgi/viewcontent.cgi?httpsredir=1&article=2431&context=urban_facpub


