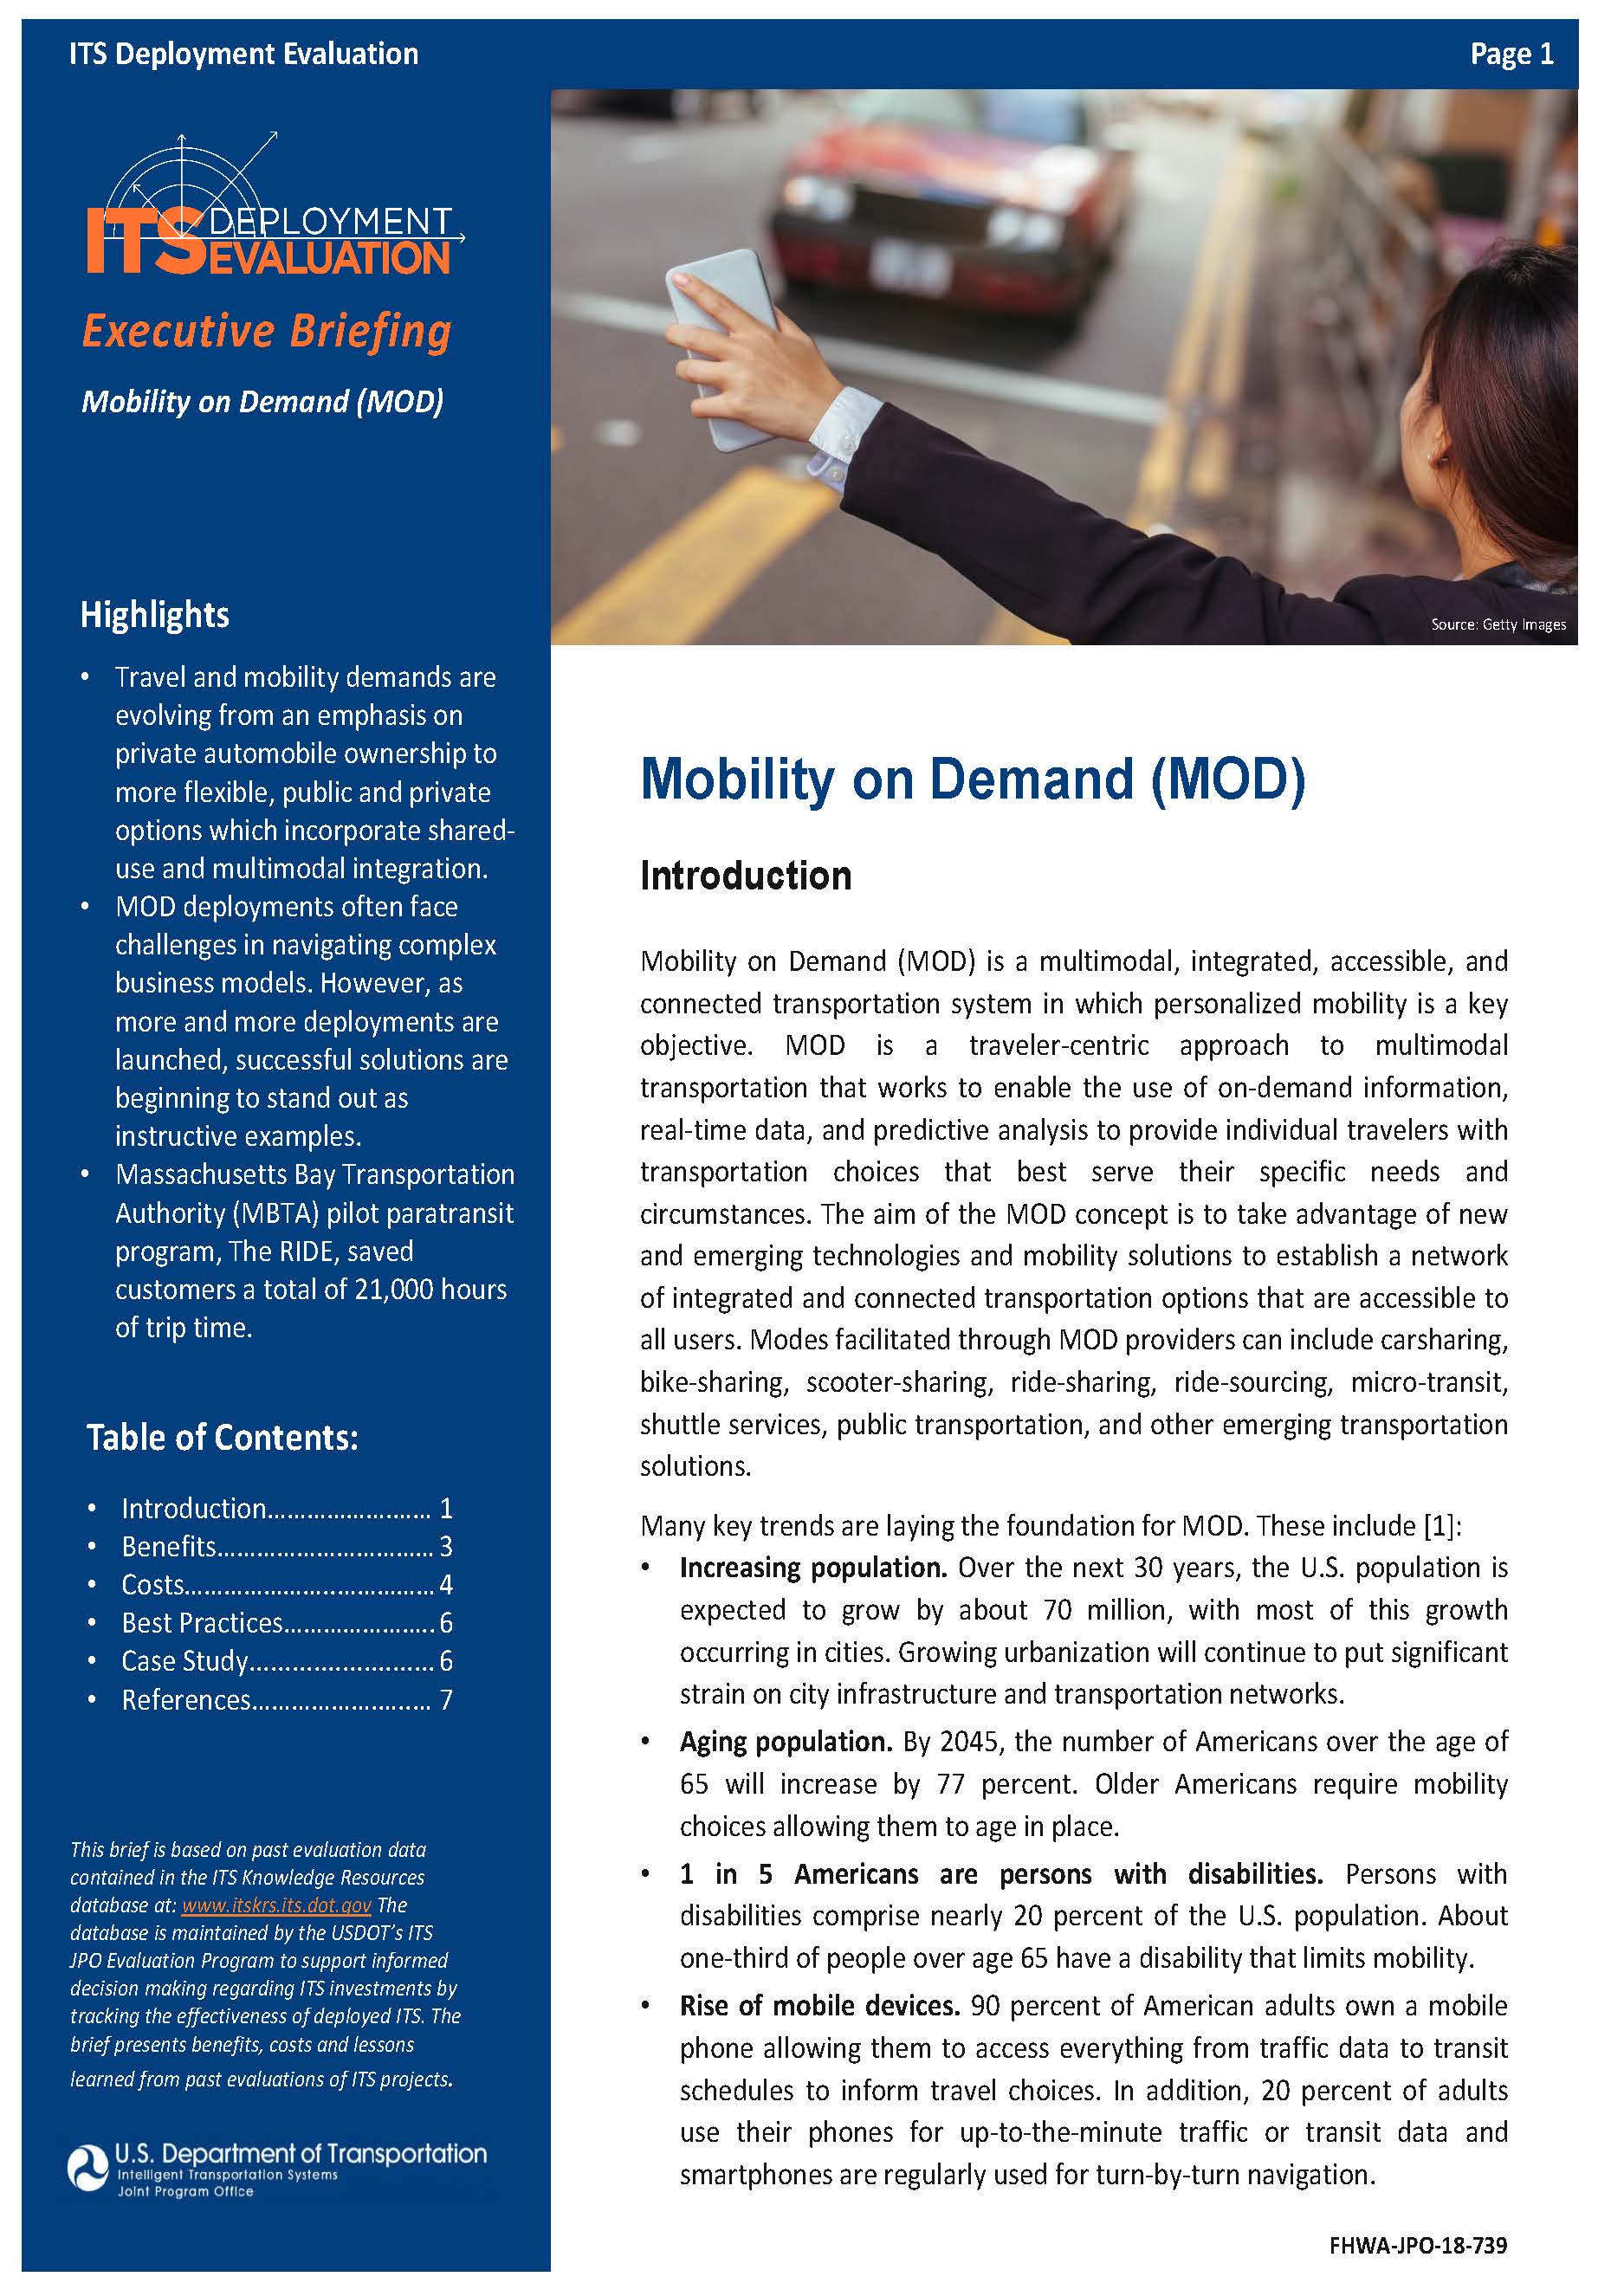
Mobility on Demand (2019 Update)
2019 Executive Briefing
BRIEFING HIGHLIGHTS:
- Travel and mobility demands are evolving from an emphasis on private automobile ownership to more flexible, public and private options which incorporate shared-use and multimodal integration.
- MOD deployments often face challenges in navigating complex business models. However, as more and more deployments are launched, successful solutions are beginning to stand out as instructive examples.
- Massachusetts Bay Transportation Authority (MBTA) pilot paratransit program, The RIDE, saved customers a total of 21,000 hours of trip time.
Introduction
Mobility on Demand (MOD) is a multimodal, integrated, accessible, and connected transportation system in which personalized mobility is a key objective. MOD is a traveler-centric approach to multimodal transportation that works to enable the use of on-demand information, real-time data, and predictive analysis to provide individual travelers with transportation choices that best serve their specific needs and circumstances. The aim of the MOD concept is to take advantage of new and emerging technologies and mobility solutions to establish a network of integrated and connected transportation options that are accessible to all users. Modes facilitated through MOD providers can include carsharing, bike-sharing, scooter-sharing, ride-sharing, ride-sourcing, micro-transit, shuttle services, public transportation, and other emerging transportation solutions.
Many key trends are laying the foundation for MOD. These include [1]:
- Increasing population. Over the next 30 years, the U.S. population is expected to grow by about 70 million, with most of this growth occurring in cities. Growing urbanization will continue to put significant strain on city infrastructure and transportation networks.
- Aging population. By 2045, the number of Americans over the age of 65 will increase by 77 percent. Older Americans require mobility choices allowing them to age in place.
- 1 in 5 Americans are persons with disabilities. Persons with disabilities comprise nearly 20 percent of the U.S. population. About one-third of people over age 65 have a disability that limits mobility.
- Rise of mobile devices. 90 percent of American adults own a mobile phone allowing them to access everything from traffic data to transit schedules to inform travel choices. In addition, 20 percent of adults use their phones for up-to-the-minute traffic or transit data and smartphones are regularly used for turn-by-turn navigation.
- Millennials’ waning interest in car ownership. Millennials are becoming less reliant on car ownership compared to previous generations. By the end of the 2000s, they drove over 20 percent fewer miles than at the start of the decade. Millennials are the first generation to have had access to internet during their formative years and are often early adopters of technology solutions including shared-use mobility services.
- Growing popularity of shared mobility and modes. There is growing popularity of shared mobility and shared modes, such as bike-sharing and ride-sourcing. The sharing economy and new transportation services are providing people with more options, helping to overcome barriers to the use of non-driving forms of transportation, and shifting individuals’ travel choices.
- Big Data era. The transportation sector is increasingly relying on data to drive decisions. Data is projected to grow by 40 percent annually. Data enables innovative transportation options such as carsharing, ridesharing, and pop-up bus services.
- Rise of connected vehicles and infrastructure. Data derived from connected vehicles provide insights to transportation operators helping to understand demand and assist in predicting and responding to movements around a city.
- Opportunities for Urban Automation. Automated transportation offers tremendous possibilities for enhancing safety, mobility, accessibility, equity, and the environment.
The transportation landscape is changing, and research in new mobility options is necessary to document, evaluate, and adequately plan for growing mobility demands, new technologies, and changing demographics, amidst challenging financial realities. New business models and the demand for situational mobility choices offer new opportunities in shared-use mobility, such as car sharing, bike sharing, ridesharing, and app-based ride-sourcing provided by Transportation Network Companies (TNCs). Likewise, there is a renewed interest in demand-responsive operations largely driven by mobile technologies and the nearly ubiquitous smartphone. Along with traditional transportation options, these new trends provide real opportunities to develop an integrated system of mobility choices focused on meeting the needs of a diverse cross section of users while enhancing the safety of all travelers. MOD is poised to contribute to this new ecosystem with connected travelers, infrastructure, innovative operations and personal mobility needs.
In 2016, the Federal Transit Administration (FTA) announced the MOD Sandbox Program, which aims to provide a platform where integrated MOD concepts and solutions, supported through key local partnerships, are demonstrated in real-world settings [2]. These projects will use smartphone apps, open data platforms, and other advanced technologies to better connect transit riders to their destinations, aided by private companies and research institutions in fields such as software development, ride-sharing, and bike-share. The 11 project selections receiving nearly $8 million in funding are described below.
| Agency | Project Description |
|---|---|
| Regional Transportation Authority (Pima County, AZ) | Integrates fixed route, subscription based ride-sharing and social carpooling services into a platform to address first mile/last mile issues. |
| Valley Metro Rail (Phoenix, AZ) | Smart phone mobility platform that integrates mobile ticketing and multimodal trip planning, including ridesourcing and bike sharing companies. |
| City of Palo Alto, CA | Commuter planning project incorporating trip reduction software, a multi-modal trip planning app, and workplace parking rebates. |
| Los Angeles County Metropolitan Transportation Authority | Mobility on demand partnership with the ridesourcing company Via to address first-mile/last-mile solutions for trips to and from certain transit stops. Includes a companion project in Seattle, WA. |
| San Francisco Bay Area Rapid Transit | Integrated carpool-to-transit program, improving access to transit stations. |
| Pinellas Suncoast Transit Authority (Pinellas County, FL) | On-demand paratransit using taxis and a ridesourcing company to provide door-to-door service. |
| Chicago Transit Authority | Incorporates local bike-sharing company Divvy into CTA's transit trip planning app. |
| Tri-County Metropolitan Transportation District of Oregon (Portland, OR) | Platform integrating transit and shared-use mobility options. By integrating data, the project will allow users to plan trips that address first/last mile issues while traveling by transit. |
| Dallas Area Rapid Transit | Integrates ride-sharing, ride-hailing, bike-sharing, and microtransit services into DART’s GoPass ticketing app. |
| Vermont Agency of Transportation | Statewide transit trip planner incorporating flex-route, hail-a-ride, and other non-fixed-route services into mobility apps. |
| Pierce Transit (Pierce County, WA) | Limited Access Connections project connects service across two transit systems – local and regional – and ridesourcing companies to increase transit use across the Seattle region. |
In 2018, FTA announced the Mobility On Demand On-Ramp program in partnership with the nonprofit Shared Use Mobility Center [3]. The program, which launched in June 2018, provides free technical support to six agencies across the country to develop MOD projects, helping them to conduct workshops and peer-to-peer exchanges to create and refine feasible MOD business plans. The six agencies and their preliminary plans are described in the next table.
| Agency | Project Description |
|---|---|
| Capital Metro (Austin, TX) | Exploring use of shared, electric, and autonomous vehicles to connect to high-frequency transit service and to provide transportation for riders with disabilities. |
| MDOT MTA (Baltimore, MD) | Developing plan to use microtransit to connect job centers in the suburbs with urban residential populations. |
| IndyGo (Indianapolis, IN) | Creating strategic plans for integrated mobility hubs in “mobility districts,” connecting them to the existing transit network. |
| Tompkins County (Ithaca, NY) | Proposing a Mobility as a Service (MaaS) pilot, establishing subscription-based transportation services to provide equitable access to city residents. |
| MATA (Memphis, TN) | Planning to develop a demand-responsive service to transport riders to arterial routes, particularly focusing on paratransit users and riders from disadvantaged neighborhoods. |
| BART (San Francisco, CA) | Aiming to create an on-demand wheelchair accessible vehicle (WAV) ride-hailing service that would provide travelers with connections to transit. |
While many of the MOD Sandbox and On-Ramp projects are still in the process of being planned, deployed, or—in the case of many of the Sandbox projects, evaluated—there are many other independent, innovative deployments across the country.
Benefits
One of the key goals of MOD is the facilitation of a diverse ecosystem of transportation options for users. By allowing public and private mobility services alike to flourish, travelers can choose whatever mode of transportation best meets their needs. This reduces their dependence on personal vehicles while simultaneously enabling cities to benefit from reductions in single-occupant vehicle (SOV) congestion. Transportation Network Companies (TNCs), for instance, also known as ride-sourcing, are extremely popular for enabling flexible, effective travel.
A report by the Transportation Research Board (TRB) used TNC trip origin-destination data in six urban regions along with surveys of over 10,000 transit and shared mobility users to investigate questions of how TNC availability and usage has actually affected the use of public transit and personal automobiles across the country (2018-01295).
The study identified several common aspects of TNC usage—for instance, that trips are most frequently booked in the evenings or on weekends—and ultimately found that TNC usage is associated with a decrease in personal vehicle ownership and SOV trips. Frequent TNC users reported owning less than one car per household, a quality shared by frequent users of public transit. Those effects, moreover, were found to stack: travelers who used both public transit and TNCs on a regular basis owned even fewer cars on average. TNC usage was also found to take place in communities of all income levels. While urban core areas were seen to have the highest volume of trips, riders were seen to board in nearly every zip code in the core counties of the study regions.

A different study, conducted by the San Francisco Municipal Transportation Agency, explored the factors affecting the adoption of TNCs and other shared-use services. It asked users why they chose TNCs in particular over other possible modes and found that speed and convenience were significant factors. In particular, TNC trips had an average total travel time ten minutes lower than would be required for similar public transit trips. This convenience factors into the decision to take TNC trips in the first place: In 66% of situations where travelers opted to use a TNC rather than take public transit, the transit journey would have taken more than twice as long as the TNC trip.
TNC trips are thus an appealing option to customers, combining the flexibility of personal vehicles without the ongoing costs of ownership and maintenance. It is also important to note that there are many avenues for TNC usage to complement, rather than directly compete with, public transit. In particular, as noted by the TRB report, TNC usage peaks at times when public transit is unavailable or operating on a significantly reduced schedule—in other words, ridesharing is not necessarily taking a bigger piece of the pie but rather expanding its overall size.
Costs
A limited number of ITS applications have been deployed to support MOD systems, with cost data not publicly reported. However, costs to operate shared used services are starting to become available.
Car-sharing
The primary concern of cities implementing a carsharing agreement involves issues of parking. Many carsharing programs have agreements with municipalities to allow for free on-street parking. The companies also have agreements with cities that provide a number of dedicated spaces, indicated by city signs, paint, or other markings.
Typically the carsharing company pays the city a fee to cover these costs, which can generate significant revenues. Depending on the agreement the car company may also pay for other costs to operate that include insurance, pilot evaluation, and car removal in cases of parking restriction violations. Information on payments made by Car2Go when launching its carsharing service is U.S. markets is shown below (2018-00395).
| City | Payment per Vehicle per Year | Notes |
|---|---|---|
| Austin, TX | $1,449 | Cost in 2011 USD. |
| Washington, DC | $2,644 | Initially paid $578,000 for 200 cars; paid an additional $215,300 to add 100 vehicles (in 2012 USD). |
| Minneapolis, MN | $1,614 – $1,689 | Cost in 2013 USD. Includes administrative cost, meter revenue recovery, event revenue recovery, and residential permits. |
| Portland, OR | $1,303 | Cost in 2015 USD. |
| Arlington County, VA | $1,645 | Cost in 2015 USD. Includes payment for pilot program administration and evaluation costs. Car2Go also agreed to move cars that have remained parked for 24 hours in areas zoned for residential permit parking and parked for 36 hours elsewhere. |
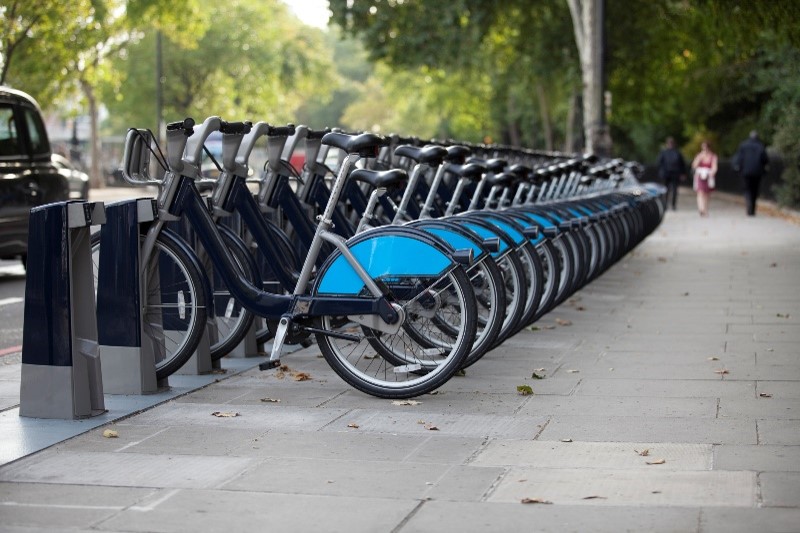
Bike-sharing
Arlington County issues annual reports detailing the revenues and expenses of its regional branch of the Capital Bike-share program (2019-00413). Bike-sharing is a service in which bicycles are made available for shared use to individuals for a short time period for a fee. The rider typically reserves and pays for the bicycle rental with a smartphone application, although many services also allow credit card payments at the docking station. Arlington reported the operating costs for the 93 stations and 698 bicycles it maintains.
| Expenses | FY2016 | FY2017 |
|---|---|---|
| System Operations | $1,713,000 | $1,685,000 |
| Management & Marketing | $297,000 | $379,000 |
| Total | $2,011,000 | $2,064,000 |
| Revenue | FY2016 | FY2017 |
|---|---|---|
| User Revenue | $988,000 | $1,004,000 |
| Sponsorships | $90,000 | $107,000 |
| Total | $1,078,000 | $1,111,000 |
The overall cost recovery ratio (the portion of operating expenses covered by user revenue and private sponsorships) in FY2017 was 49 percent. Arlington County has a goal to minimize operating costs while providing an effective service at the regional and local levels.

Best Practices
Private Transit
Because they typically involve coordination between both public and private transportation providers, MOD deployments often face challenges in navigating complex business models. However, as more and more deployments are launched, successful solutions are beginning to stand out as instructive examples. A recent report by the Transit Cooperative Research Program (TCRP) explored business relationships between public transit agencies and private transit providers, providing an overview of existing private services and discussing how they influence the communities in which they operate (2018-00826). Building off of three case studies, it also details lessons learned and offers best practices for bringing both public and private stakeholders to the table to develop a robust policy and regulatory approach. It recommends the following to agencies:
- Allocate street space to reflect public priorities without stifling private-sector innovation. Develop policy tools to prioritize public and private goals for access to curb space and rights-of-way. Such policies could help clarify and make predictable for all stakeholders what transportation uses are permitted in which locations and do so with a clear public rationale and process.
- Update local and state licensing of private transportation services to reflect evolving business practices and emerging models. This helps build a better understanding of the size and extent of the private transportation market as it exists today.
- Use private transit services as an "early warning" to indicate how and where service needs and markets are changing. The presence of private transit services in a corridor can suggest where new or more frequent public transit routes are needed.
- Anticipate that conflict may be heightened by reconfiguration of public space. Include private transit providers in project planning, and open lines of communication with private providers known to be operating in a corridor before changes start to take place.
- Incorporate private operations into emergency planning and response. Private transit services have been enlisted to provide transportation services when public transit was overwhelmed in the wake of several natural disasters.
Case Study
The MBTA, which operates most public transportation in the greater Boston area, launched a ridesharing pilot program in October 2016 to help address rising costs for its paratransit program, “The RIDE” (2019-01342). The service, which is required by the Americans with Disabilities Act, is designed to provide transit service to travelers with disabilities. However, the MBTA faced rising costs despite flat ridership levels, and the service was known for being inflexible or inconvenient for passengers at times.
To help modernize its service, the MBTA partnered with the TNC providers Uber and Lyft. Qualified RIDE users were encouraged to book trips through the respective companies’ smartphone apps or a call center; the agency would then subsidize up to $13 of the resulting trip. This allowed the agency to provide faster, more flexible rides to its users. Throughout the pilot, the agency continued offering its traditional RIDE trips, which used ADA-compliant vehicles.

Because of its partnerships, the MBTA was able to significantly reduce the cost of providing paratransit to its users. Many riders switched from using traditional RIDE trips to using MBTA-subsidized TNC trips. Because these TNC rides were over eighty percent cheaper than traditional RIDE trips—costing the MBTA an average of $9 per journey, rather than $59—the agency was able to reduce the overall cost of its paratransit program despite a ridership increase of over 30 percent.
Moreover, the flexibility and quality of service afforded by the TNCs’ scheduling and routing system resulted in higher customer satisfaction and significant time savings. The MBTA reported that the pilot saved customers a total of 21,000 hours of trip time that would otherwise have been lost to inefficient scheduling or lag time.
The MBTA attributed the success of its pilot to a variety of factors. Key among these was a dedication by stakeholders to equivalent service for all customers, supplemented by a customer/advocate task force to identify travelers’ needs, as well as a communal goal to establish long-term relationships. The MBTA also ensured that it had a robust data agreement that allowed it to test and iterate the program to maximize efficiency.
Several key challenges were also identified. These included the need to create clear channels for customer help and feedback, increasing adoption of customers with accessibility needs, and the need to control for latent demand of existing riders. For its success at providing effective and efficient service, the MBTA has extended the RIDE program though the middle of 2019 and continues to grow the scale of the program.
Highlights
- Travel and mobility demands are evolving from an emphasis on private automobile ownership to more flexible, public and private options which incorporate shared-use and multimodal integration.
- Ridesharing is not necessarily taking a bigger piece of the pie—it’s expanding its overall size.
- However, as more and more deployments are launched, successful solutions are beginning to stand out as instructive examples.
- The MBTA pilot saved customers a total of 21,000 hours of trip time.
References
- Mobility on Demand Research Program Framework. MOD Fact Sheet, USDOT Federal Transit Administration, September 2016. https://www.its.dot.gov/factsheets/pdf/Mobility onDemand.pdf.
- “U.S. Transportation Secretary Foxx Announces $8 Million in Groundbreaking Mobility on Demand Grants to Transform Public Transit.” MOD Fact Sheet, USDOT Federal Transit Administration. https://cms.dot.gov/sites/dot.gov/files /docs/FactSheet_MOD_20161013.pdf.
- “Mobility on Demand On-Ramp.” Shared Use Mobility Center. https://sharedusemobilitycenter.org/mobilityon-demand-on-ramp-program-description/.