2019 Executive Briefing
 BRIEFING HIGHLIGHTS:
- A variety of Active Traffic Management strategies are available to manage congestion and increase safety and throughput on the transportation network.
- ATM strategies have been shown to effectively reduce speed limits in work zones, making safe conditions for construction workers by limiting the impacts of congestion and improving travel time and reducing crash rates.
Introduction
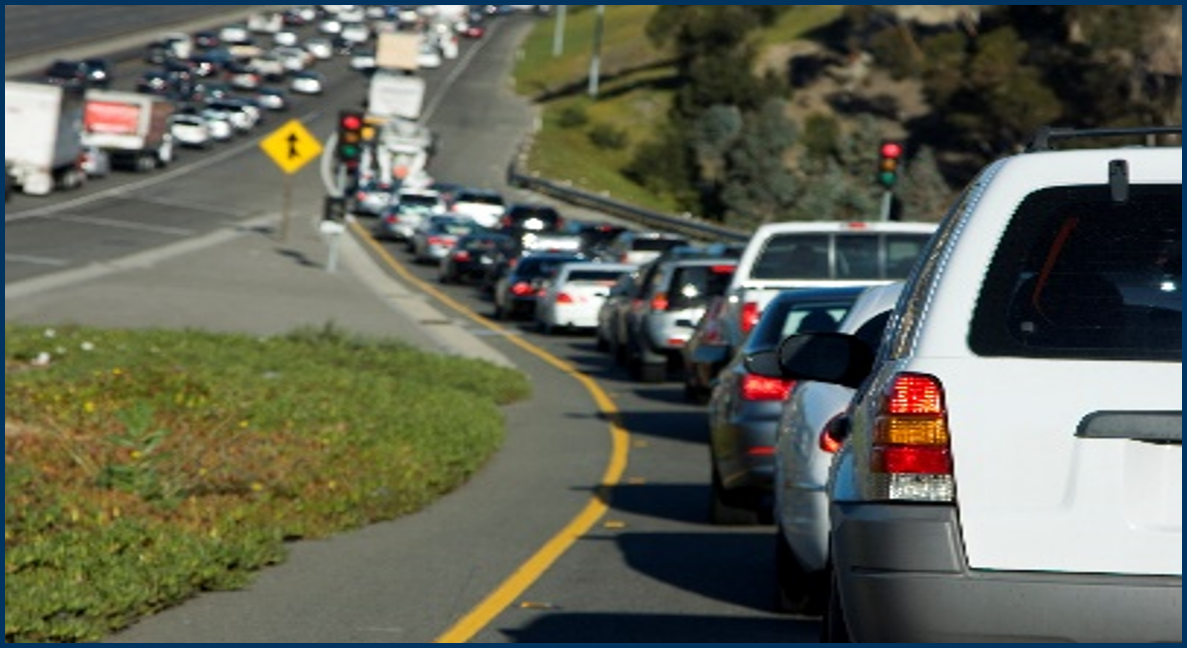
A variety of ITS strategies improve the operation of the freeway system. Active Traffic Management (ATM) refers to a suite of strategies that actively manage traffic on a facility. ATM has the ability to dynamically manage recurrent and non-recurrent congestion based on prevailing and predicted traffic conditions. Focusing on trip reliability, it maximizes the effectiveness and efficiency of the facility. ATM approaches focus on influencing travel behavior with respect to lane/facility choices and operations. ATM strategies can be deployed singularly to address a specific need such as utilizing adaptive ramp metering to control traffic flow or can be combined to meet system-wide needs of congestion management, traveler information, and safety resulting in synergistic performance gains [1].
Some examples of ATM strategies include:
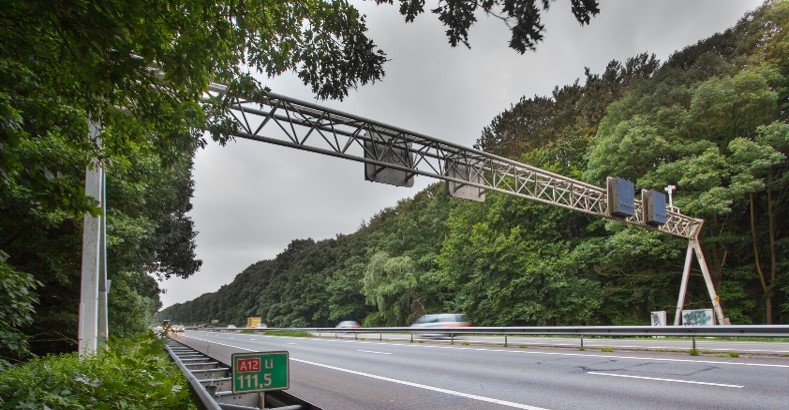
- Variable Speed Limits (VSL): Adjustable speed limits based on real-time traffic, roadway, and/or weather conditions. Dynamic speed limits can either be enforceable (regulatory) speed limits or recommended speed advisories, and they can be applied to an entire roadway segment or individual lanes.
- Ramp Metering: Traffic signal(s) on ramps to dynamically control the rate vehicles enter a freeway facility
- Queue Warning: Real-time in-vehicle and roadside messages that warn travelers of traffic congestion and queuing ahead.
- Dynamic Lane Control: Dynamic opening and closing of select travel lanes based on real-time traffic information typically displayed through dynamic lane control signs.
- Dynamic Shoulder Use: Enabling use of shoulder travel lanes based on real-time congestion levels.
Benefits
Variable Speed Limits (VSL)
Presenting drivers with speed limits that are appropriate for current conditions may reduce speed variance, a concept sometimes called speed harmonization. If properly designed, VSL systems have been shown to reduce frequency of crashes, improve system travel time, and increase uniformity in traffic speeds.
Some selected benefits are shown in Table 1.
Source: Getty Images
| Portable variable speed limit system in Utah successfully reduced traffic speeds by 15 to 25 mi/h near work zones (2018-01279). |
| Variable speed limits cut crash rates by more than half during low visibility on I-77 in Virginia (2018-01331). |
| An implementation of proactive variable speed limits was projected to reduce critical traffic conditions by 39 percent (2018-01296). |
Ramp Metering
By smoothing the flow of traffic onto the mainline, the system allows efficient use of existing freeway capacity. Adaptive ramp metering utilizes traffic responsive or adaptive algorithms (as opposed to pre-timed or fixed time rates) that can optimize either local or system-wide conditions.
Selected results from ramp metering deployments are listed in Table 2.
| In a recurring congestion scenario, ramp metering, variable speed limits, and hard shoulder running were found to improve system delay by 5 to 16 percent (2018-01332). |
| When combined, ramp metering and variable speed limits can reduce conflicts by 16.5 percent and crash odds by 6.0 percent (2018-01253). |
| Ramp metering and dynamic speed limits were shown to reduce congestion and shorten average travel times by about 2.5 minutes on a 7.8 km stretch of the A25 motorway in France (2018-01304). |
Costs
| Utah DOT rented equipment for a portable variable speed limit system for an average daily cost of between $173 and $329 (2018-00404). |
| An Active Traffic Management (ATM) system covering 12.4 miles of I-66 in Northern Virginia cost $39 million. Of this cost, approximately $24 million was spent on gantries, sensors, and traffic control devices to implement ATM, with the remainder being spent on upgrades to existing infrastructure such as cameras and communications systems (2018-00403). |
| More than $224 million will be invested in Ohio’s 33 Smart Mobility Corridor by 2020 (2018-00408). |
Best Practices

Utah Department of Transportation (UDOT) implemented dynamic management of portable variable speed limit (PVSL) technology to reduce regulatory speed limits in active work zone control areas. This PVSL system used a dynamic VSL algorithm to raise and lower regulatory speed limits. The PVSL system also provided a queue warning algorithm that operated independent of the VSL algorithm to control roadside messages posted on portable dynamic message sign trailers.
The following best practices were gathered from the UDOT deployments (2018-00827).
Construction equipment may interfere with traffic detection.
| “The idea is not to simply react to changing conditions but to anticipate them and actively manage the system prior to their occurrence.” FHWA Office of Operations |
Construction equipment operating at a low speed can interfere with automated work zone traffic control systems. When estimating traffic speeds in active work zones, it is likely better to use a five-minute rolling average instead of one-minute rolling average to account for these variations. Additionally, conduct sensitivity testing of the algorithm logic used to control the VSL system.
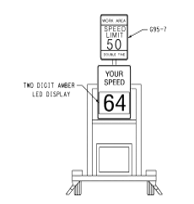
Figure 4: Portable Variable Speed Limit (PVSL) Signage System. Source: MD State Highways If no data are received from portable vehicle detection equipment, post the last known speed limit. Communications between portable roadside dynamic message signs and traffic detection trailers can be interrupted when workers begin to relocate detectors to accommodate work zone progression down the roadway. In these scenarios, the report recommended posting the last known speed limit.
- Move portable vehicle detection equipment first before moving other equipment. If the proper sequence of operations is followed, PVSL devices will have the last recommended speed limit posted until all equipment required for proper operation is relocated.
Case Study
I-66 Active Traffic Management System
The Virginia Transportation Research Council (VRTC) conducted an evaluation of the I-66 ATM system in Northern Virginia to quantify the operational and safety improvements of the deployment (2018-01336). The study sought to determine the effect different components of the ATM system had on travel time, travel time reliability, and safety along the corridor.
Methodology
One of the most recent ATM deployments was in Northern Virginia on the I-66 corridor. In early 2013, construction began on a Virginia Department of Transportation (VDOT) project to install an ATM system on I-66 from US 29 in Centreville to the Capital Beltway. Construction was completed in September 2015 and spanned approximately 12.4 miles. The primary ATM strategies implemented on I-66 included:
- Variable Speed Limits: On I-66, the normal posted speed limit is 55 mph, but the VSL system can post speeds between 35 mph and 50 mph above each lane depending on traffic conditions. An automated algorithm calculates the desired speed limit based on traffic speed measurements from sensors to create smooth transitions into and out of congestion.
- Hard Shoulder Running (HSR): The I-66 HSR system dynamically opened or closed the shoulder lanes depending on roadway conditions. Decisions on whether to open or close the shoulder were based on the judgment of the operators in the traffic operations center (TOC).
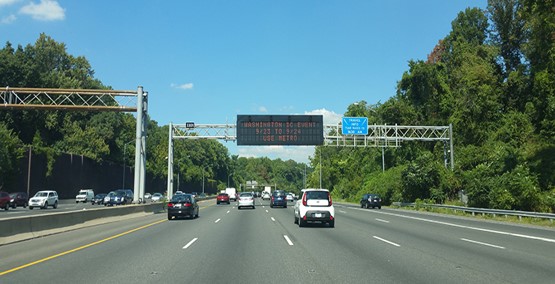
- Lane Use Control Signals (LUCS): For incident and work zone management, overhead gantries were deployed with LUCS to alert drivers to lane blockages. LUCS could be used to indicate specific lanes that were closed in advance of the blockage. Open lanes were marked with a green arrow, closed lanes with a red X, and lane closure ahead with a diagonal yellow arrow.
Since the ATM system was activated in September 2015, an evaluation report released in October 2018 covered its performance from October 2015 through November 2017 for the operational analysis and from October 2015 through December 2016 for the safety analysis. Segment-level analysis was performed to determine the segments that had benefitted the most from the implementation of the ATM system.
Findings
The operational analysis showed that travel time improved significantly during off-peak hours after the ATM system was activated but that travel time during peak periods in the peak direction of travel generally did not improve. Most of these improvements occurred on HSR segments.
The safety evaluation showed 6 percent, 10 percent, and 11 percent reductions in total (all severity), multiple-vehicle (all severity), and rear-end (all severity) crashes, respectively. Further analysis again demonstrated segments with HSR saw the largest safety improvements.
References
- "Active Transportation and Demand Management." FHWA Website, https://ops.fhwa.dot.gov/atdm/index.htm.


