Curbside Management
2023 Executive Briefing
BRIEFING HIGHLIGHTS
- The Institute for Transportation Engineers (ITE) has identified six steps that should be taken to optimize curbside management.
- DC’s piloting of the curbFlow app to manage curb use found that during 3 months of the pilot, illegal double-parking and U-turns decreased by 64 percent.
- The City of Boston found that accounting for adequate staffing needs is important to ensure Curbside Management strategies can be effectively deployed.
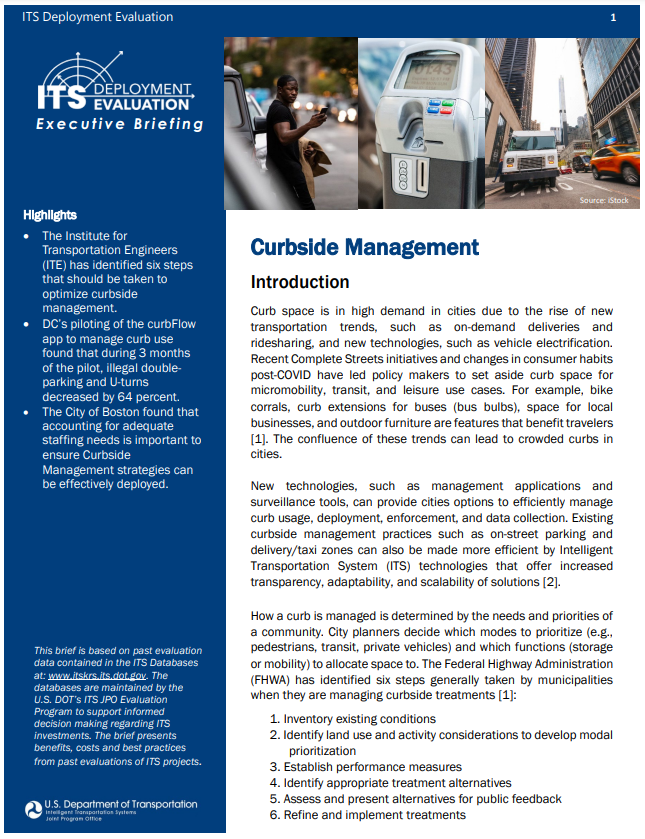
Introduction
Curb space is in high demand in cities due to the rise of new transportation trends, such as on-demand deliveries and ridesharing, and new technologies, such as vehicle electrification. Recent Complete Streets initiatives and changes in consumer habits post-COVID have led policy makers to set aside curb space for micromobility, transit, and leisure use cases. For example, bike corrals, curb extensions for buses (bus bulbs), space for local businesses, and outdoor furniture are features that benefit travelers [1]. The confluence of these trends can lead to crowded curbs in cities.
New technologies, such as management applications and surveillance tools, can provide cities options to efficiently manage curb usage, deployment, enforcement, and data collection. Existing curbside management practices such as on-street parking and delivery/taxi zones can also be made more efficient by Intelligent Transportation System (ITS) technologies that offer increased transparency, adaptability, and scalability of solutions [2].
How a curb is managed is determined by the needs and priorities of a community. City planners decide which modes to prioritize (e.g., pedestrians, transit, private vehicles) and which functions (storage or mobility) to allocate space to. The Federal Highway Administration (FHWA) has identified six steps generally taken by municipalities when they are managing curbside treatments [1]:
- Inventory existing conditions
- Identify land use and activity considerations to develop modal prioritization
- Establish performance measures
- Identify appropriate treatment alternatives
- Assess and present alternatives for public feedback
- Refine and implement treatments
Several resources exist for helping planners with each of these steps. The FHWA has published a Curbside Inventory Report which details best practices and specific techniques for inventorying existing curbside use and for collecting data after public authorities have implemented changes to curbside use [1].
The Seattle Department of Transportation (SDOT) has created a matrix to help guide how their curbsides are programmed based on nearby land use. SDOT organized possible curbside functions into six categories which are given varying level of priority for residential, commercial, and industrial environments, as seen in Table 1 [3]. The Institute of Transportation Engineers also publishes a Curbside Management Practitioners Guide [4].
| Residential | Commercial & Mixed Use | Industrial | |
|---|---|---|---|
| Support for Modal Plan Priorities | Support for Modal Plan Priorities | Support for Modal Plan Priorities | |
| Access for People | Access for Commerce | Access for Commerce | |
| Access for Commerce | Access for People | Access for People | |
| Greening | Activation | Storage | |
| Storage | Greening | Activation | |
| Activation | Storage | Greening |
Benefits
Successful curbside management improves safety, increases efficiency, and accommodates the conflicting demands for the public right-of-way. ITS tools can play a key role in meeting these goals. While curbside space has traditionally been allocated on a first-come-first-served basis, scheduling applications now make curbside reservations possible. In addition, enforcement of curb use is no longer contingent on the size and allocation of staff; surveillance tools such as cameras and sensors can assist in monitoring use and detecting illegal behavior. Examples of this include:
- DC curbFlow. The District of Columbia’s Department of Transportation partnered with private company curbFlow, an app that orchestrates curb use, for a three-month pilot to understand how reservation-based curb use would affect commercial delivery and ride-hailing pick-up and drop-off services. The results from the pilot showed that reservation-based curb use decreased double parking and illegal U-turns by 64 percent. It was also found that on-demand deliveries lasted 7-11 minutes and ride-hailing use averaged less than 2.5 minutes (2019-B01420).
- SFpark Evaluation. The SFpark project is a demand-based pricing parking management system used in San Francisco to improve parking utilization. The San Francisco Municipal Transportation Agency (SFMTA) received an $19.4 million grant in 2010 from the Federal Highway Administration to explore demand-based pricing for congestion mitigation. The initial project adjusted the hourly rate of parking prices based on the occupancy rate of the parking area. The target occupancy rate was 60-80 percent, with the price increasing above 80 percent occupancy and decreasing below 60 percent occupancy. As a result, users reported a 43 percent decrease in time searching for a parking space. Less driving time also led to a 30 percent decrease in greenhouse gas emissions (2024-B01818).
- Penn Quarter/Chinatown Parking Pricing Pilot. The Penn Quarter/Chinatown Parking Pricing Pilot was a demand-based pricing pilot applied to on-street parking in Washington D.C. with the goal of improving parking utilization, vehicle turnover, and double parking. The pilot implemented demandbased pricing by increasing parking prices on high-demand blocks and lowering prices on lowdemand blocks. This led to improved turnover on the high demand blocks and incentivized parking on the low-demand blocks. Prices varied by day of the week, time of day, block, and side of street. The results of the pilot showed that the usage of parking on high-demand blocks and low-demand blocks increased by 10 and 12 percent, respectively. Also, users reported a seven-minute decline in search for a parking space (2023-B01798).
- Seattle Lockers. SDOT in Seattle, Washington piloted a 4-week “smart locker” program in a downtown 62-floor office building to assess the impact consolidated drop-off locations could have on parcel delivery times.
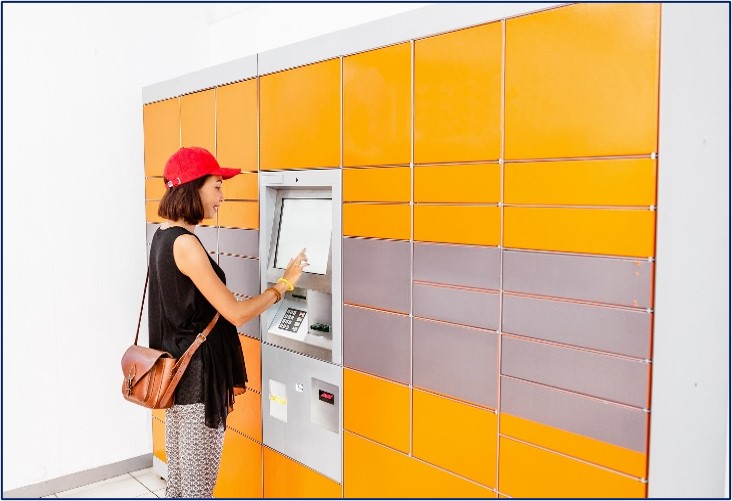
In the pilot, instead of taking the elevator and delivering packages at each of the office doors, the delivery person could drop all packages at a locker system for the receiver to pick up at their convenience. The locker system reduced average delivery time spent in buildings by 78 percent, which resulted in reduced truck dwell times on the curb. SDOT determined that even more efficiencies could be realized if the lockers’ ITS platforms were synced with each vendors ITS systems (2019-B01431).
Costs
Given the diverse nature of curbside management tools, cost structures range widely. Some ITS curbside management tools, such as parking management tools, can be free for a city if the cost burden is placed on the consumer of the service [5]. In other cases, where physical infrastructure is invested in by the municipality, the costs burden may be more significant.
- Smart Parking Meters. In 2020, the City of Milwaukee, Wisconsin decided to pilot parking meters that can communicate with apps, street sensors and cameras to help the parking agency automate services. Each parking meter cost between $200-$500 per meter installed and were tested in five locations in the city (2020-SC00470).
- License Plate Recognition. License plate recognition (LPR) technology is a tool that monitors and records the location of vehicles and provides parking enforcement agencies the capacity to monitor large volumes of vehicles. LPR can help agencies track permit compliance, monitor parking-duration, and track vehicle location. These tools make enforcement more efficient, which in turn helps keep curbsides free for intended use. The cost of adding LPR equipment to a vehicle, including installation of cameras, a processing unit, and a PC/navigator set-up, was approximately $50,000-$65,000 (2020-SC00456).
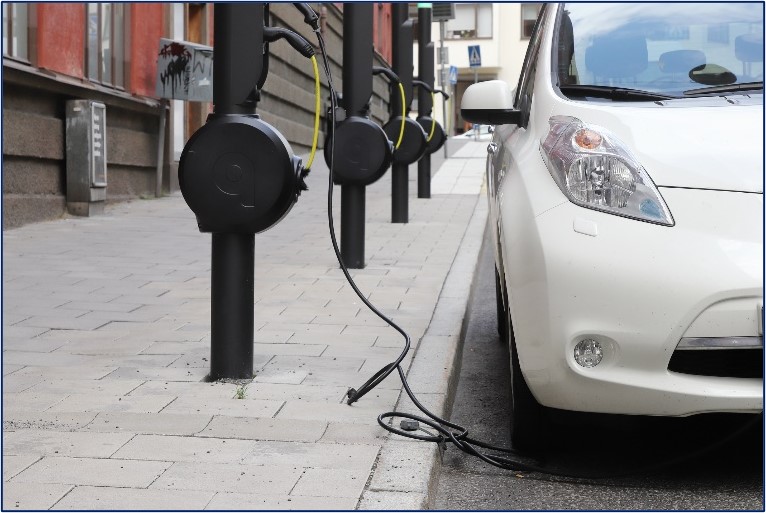
- Electric Vehicle Charging Stations. By installing electric vehicle (EV) charging stations at the curb, communities can encourage the adoption of EVs and provide charging opportunities for residents who may not have a private driveway. EV charging stations prioritize EVs and can be part of a larger community strategy to meet environmental goals. In 2015, the U.S. Department of Energy (DOE) reported on the cost of non-residential EV charging stations across the country. The DOE found large price discrepancies across projects and suggested that the best way to determine the cost of EV charging stations and installation is to seek price estimates from the utility company, manufacturers, and installers local to the project. Per unit and installation cost estimates released by the DOE were categorized by charging unit type, as seen in Table 2 (2020-SC00455).
| Charging Station | Cost Per Unit | Installation Cost |
|---|---|---|
| Level 1 | $300 - $1,500 | $0 - $3,000 |
| Level 2 | $400 - $6,500 | $600 - $12,700 |
| DC Fast Charging | $10,000 - $40,000 | $4,000 - $51,000 |
Best Practices
Single use allocation of curb space is becoming a less viable option for cities. Municipalities are finding that a more flexible approach to curbside management helps them meet sustainability goals, increase safety, and improve mobility. As cities implement adaptive use policies some of the lessons learned include:
- Collect detailed data and establish measures of effectiveness. The FHWA’s Curbside Inventory Report recommends collecting detailed data about existing curbside uses such as allocations of space, monetization of curb space, and policies before trying to change curbside management practices. The report also recommends establishing clear Measures of Effectiveness (MOEs) before beginning a curbside management project to understand if it achieves its stated goals [2]. The City of Boston, Massachusetts provides an example of successful data collection. Using sensors attached to parking meters, the City of Boston measured the effects of performance parking on two of its downtown neighborhoods, the Back Bay and Seaport. The data supported performance parking’s ability to increase parking availability, lower congestion, and improve road safety. Boston also found that operational coordination was key. Successful future implementation requires coordination among payment vendors and consensus on the number of parking spaces per block. For example, the sensors were not always reliable; making the data useful required manually counting parking spots per block, the number of which was previously unknown (2020-L00936).
- Consider equity. FHWA’s Curbside Inventory Report recommends entities consider equity when undertaking curbside management projects. Project leadership should conduct robust public outreach throughout the project. Leaders should interrogate existing biases in data availability, data collection, and curbside policies before beginning projects [2]. A good example is how the San Francisco Municipal Transportation Agency (SFMTA) addressed curb equity in its 2020 Curb Management Strategy, where it recommended promoting accessibility in curb management and reducing the use of Muni “flag stops,” where a vehicle stops in the street rather than pulls to the curb, and developing guidelines for when they are permitted (2023-L01197).
| On-street parking converted to Pick-up/Drop-off Zones (PUDO Zones) during peak hours in commercial districts can improve safety and reduce double parking. |
- Plan for enforcement of Pick-up/Drop-off Zones. The FHWA Curbside Inventory report recommends identifying operational and enforcement issues, such as double parking or blockages of travel lanes, when developing a project [2]. The District of Columbia has several entertainment districts that have fluctuating demand for transportation network companies (TNC) services, with peak demand during weekends and evenings. TNC drivers compete for limited curb space with parked cars and other TNC vehicles. To help increase safety for those entering and exiting these vehicles, D.C. designated certain blocks to be Pick-up/Drop-off Zones (“PUDO Zones”) during peak demand while maintaining street parking outside of those times. D.C.’s mobility application was updated to show the new zones. These changes reduced double parking and increased pedestrian safety for those using TNC’s, but only after an increased enforcement was placed on the zone. After implementing more aggressive towing of parking vehicles, the benefits of the PUDO zone were realized and similar zones were added across the city (2020- L00948).
- Consider staffing implications. While in most cases technology can add efficacy to staff’s time, sometimes the deployment of ITS tools come with upfront increased demands on staff time. Some new technologies require a standardized dataset of the right-of-way to make their data applicable and reliable. If that standardized database does not already exist, additional staff time may be required to prepare for an ITS deployment. The City of Boston, Massachusetts piloted performance-based parking in two of its downtown neighborhoods to understand the effect of dynamic pricing on parking distribution. Before starting the pilot, Boston had not predicted the amount of staff time the pilot would consume. They found that the data from the sensors were not always reliable, and the issue was exacerbated by the city not having an official database of parking spaces to pair the data with. Resulting needs of the staff included: calibration of sensors, coordination of price changes between different technology systems and vendors, manually checking meters to confirm price changes, and counting the number of parking spaces per block. In order to expand the pilot, Boston estimated it would need one full-time project manager and one part-time data analyst for every three to five zones created (2020-L00936).
- Transit. The implementation of high-quality curbside management strategies targeting transit, such as transit lanes and bus bulbs, leads to safer roadways and increased service levels. Dedicated transit lanes allow buses to operate in their own lane on roadways, which reduces congestion on roads. Bus bulbs or bus boarding islands are curb extensions that allow transit vehicles to stop without leaving the traffic lane. They are usually implemented on curbsides that already include parking or bike lanes where buses cannot pull over, reducing bus-vehicle conflicts [4].
Success Story
Los Angeles, CA: Curb Inventory Mapping
Urban Movement Labs, a local Los Angeles-based technology organization, partnered with CurbIQ and IBI Group in summer 2021 for a curbside data collection pilot in three different neighborhoods of Los Angeles. CurbIQ is a software that helps collect and digitize curb regulations using a Shared Streets open-data format. In total, 83 miles of curbside data were collected and digitized.
The project uncovered a couple key findings when thinking about digitizing a curb. First, it found that low-to-medium densities are ideal for candidates for mobile mapping, where buildings are only a few stories high, and that utilizing an app to capture curb signage while driving through these neighborhoods shaves off one-eighth the time versus the traditional method of walking the street with similar accuracy, whereas dense areas in city centers do not work as well with augmented mapping due to taller buildings obscuring GPS data [6].
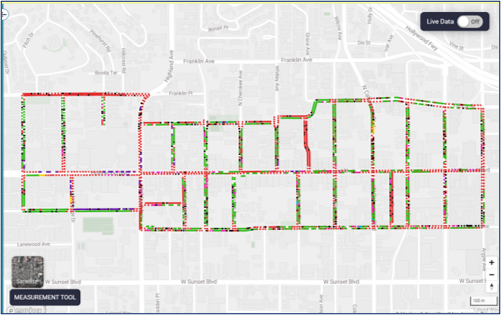
Secondly, it found that algorithms need to be perfected for sign detection when utilizing mobile mapping. While the program was able to detect over 90% of the signs correctly, there were certain types of signs, such as stacked signs or unique accessibility signs found in L.A. communities, that the mobile mapping could not accurately detect, with a recommendation to refine algorithms and that a quality control (QC) process be put in place [6].
The curb inventory demonstrations done during this pilot could be applied to larger digitizting efforts, such as Los Angeles’ Code the Curb initiative to digitize curb regulations in the city.
References
- “CurbIQ Los Angeles Curb Inventory Pilot,” Arcadis IBI Group. https://www.ibigroup.com/ibiprojects/curbiq-digital-curb-inventory-pilot-los-angeles/ (accessed Sep. 11, 2023).
- M. Roe, “Curb Appeal: Curbside Management Strategies for Improving Transit Reliability.” NACTO, Nov. 2017. https://nacto.org/wp-content/uploads/2017/11/NACTO-Curb-Appeal-CurbsideManagement.pdf
- “Flex Zone/Curb Use Priorities in Seattle - Transportation | seattle.gov,” www.seattle.gov. https://www.seattle.gov/transportation/projects-and-programs/programs/parking-program/parkingregulations/flex-zone/curb-use-priorities-inseattle#:~:text=On%20Seattle%20streets%2C%20buses%2C%20cars (accessed Sep. 08, 2023).
- M. Mitman. “Curbside Management Practitioners Guide.” ITE, Nov. 2018. https://www.ite.org/pub/?id=C75A6B8B-E210-5EB3-F4A6-A2FDDA8AE4AA
- M. Hammon. “Manage the Curb With Smart Loading Zones.” American Planning Association, March 1, 2021. https://www.planning.org/planning/2021/winter/manage-the-curb-with-smart-loadingzones/#:~:text=The%20app%20is%20free%2C%20with%20no%20outlay%20costs,it%20possible%2 0for%20cities%20to%20monetize%20the%20curb.
- “CurbIQ Los Angeles Curb Inventory Pilot,” Arcadis IBI Group. https://www.ibigroup.com/ibiprojects/curbiq-digital-curb-inventory-pilot-los-angeles/ (accessed Sep. 11, 2023).

