 BRIEFING HIGHLIGHTS
- ITS can help enhance the safety of bus operators, passengers, people waiting at bus stops, passengers alighting, and other road users that share the road with transit vehicles, including pedestrians, bicyclists, micromobility users and other motor vehicle users.
- Washington D.C. launched the Clear Lanes program, which uses camera technology to detect and warn/ticket illegally parked and stopped vehicles in dedicated bus lanes and bus zones.
Introduction
Transit vehicles operating at-grade must perform under challenging conditions. Maneuvering large vehicles in congested spaces and reduced visibility is difficult. Additionally, collisions involving a transit vehicle under the same conditions may be more severe than those with a smaller vehicle due to the transit vehicle's size and weight. Intelligent Transportation Systems (ITS) can contribute to the enhanced safety of transit modes as well as increased public perception of transit safety.
According to the Safety & Security Major Event Time Series Data hosted on the National Transit Database (NTD), since 2020, yearly fatalities related to transit buses have been increasing. The annual average number of fatalities from 2020-2022 is up to 118. The previous three years, 2017-2019, saw an annual average of 92 bus-related fatalities. This trend is consistent when normalizing by vehicle revenue miles (VRM). The more recent three-year period shows 4.8 fatalities per 100 miles of VRM, while the earlier period shows 3.1 fatalities per 100 miles of VRM. The majority of this increase in fatalities consists of occupants of other vehicles than the bus; however, there has been a slight uptick in bus-related fatalities of bus passengers, people waiting for or leaving the bus, and pedestrians crossing at intersections [1].
The U.S. Department of Transportation (U.S. DOT) prioritizes safety by protecting both transit workers and riders from injuries and ensuring safe transit conditions. The Federal Transit Administration (FTA) strengthens State Safety Oversight (SSO) programs by enhancing safety training, reducing assaults on vehicle operators, encouraging the development of safety plans for transit agencies, and implementing measures to prevent collisions between vehicles and pedestrians with transit vehicles [2].
There are more FTA programs emphasizing transit safety. For instance, the Bus Compartment Redesign Program (BCP) and Bus of the Future initiatives seek to implement technologies that would help transit agencies reduce the number of assaults on bus operators and increase bus operator visibility to improve pedestrian and other road user safety [3]. The Enhanced Transit Safety and Crime Prevention Initiative and Urbanized Area Formula Grants Program can provide funding for security projects like increased camera surveillance and ITS designed to improve transit system safety [4]. In June 2023, the Advanced Driver Assistance Systems (ADAS) for Transit Buses Demonstration and Automated Transit Bus Maintenance and Yard Operations Demonstration Program awarded $11.6 million to six projects to research transit automation for improved safety and efficiency [5].
Read on to learn about how ITS can contribute to transit safety including benefits, costs, and best practices.
Benefits
ITS technologies can help address issues with safety regarding bus operators, passengers, people waiting at bus stops, passengers alighting, and other road users that share the road with transit vehicles, including vulnerable road users (VRUs) and other motor vehicle users. Examples include:
- Advanced Driver Assistance Systems (ADAS) such as collision avoidance systems (CAS), forward collision warning, lane departure warning, advanced driver distraction warning, vulnerable road user detection, blind spot detection systems, and more.
- Bus turning announcements that warn pedestrians through external speakers (“Caution! Bus is turning”).
- Connected vehicle applications such as transit/pedestrian crossing warning systems.
- Transit signal priority (TSP) that can result in smoother bus driving behavior, which likely increases safety.
- Transit vehicle security systems, such as video cameras, covert microphones, silent alarms, and automatic vehicle location (AVL) that monitor and respond to situations onboard vehicles and along transit routes.
As more ADAS deployments are being undertaken by transit agencies, the safety benefits of these systems are coming into focus. An active safety-collision warning pilot in Washington State estimated a potential upper bound of annual total net benefit between $1.1M and $2.1M due to prevention of collisions with vehicles, pedestrians, and bicyclists (2023-B01799). In Miami-Dade County, Florida, a camera vision-based CAS installed on buses had a benefit-cost ratio ranging from 1.24 to 1.86 on routes with high historical crash rates (2020-B01478). One European model estimated that deployment of vulnerable road user detection and warning systems on buses and coaches across the entire European Union fleet would yield a benefit-to-cost ratio of 10.2 (2021-B01614). In Gainesville, Florida, a driver assistance system implemented on ten buses lead to reduced vehicle-to-pedestrian and vehicle-to-vehicle conflicts, with improved safety impacts. ADAS equipment was installed on several buses. In the before (control) period, conflict scenarios would be logged as “alerts” but not inform the drivers. In the after (experimental) period, drivers received the alerts. A before-after analysis of this deployment revealed a 34.17 percent average reduction in the number of alerts for the six different types of alerts, the most prevalent being headway warning, aggressive braking, and pedestrian collision warning. Finally, a focus groups of bus drivers showed about 75 percent of the drivers found the system useful and 76 percent said that they felt the ADAS improved safety (2022-B01686).
Connected vehicles (CV) applications, although still early in the technology lifecycle, are being deployed in pilots across the nation, with several CV transit safety applications. For example, a pedestrian crossing warning system in Cleveland, Ohio that included 24 buses and three instrumented intersections reduced bus driver reaction time to pedestrian conflicts by 19 percent. Of alerts provided by the system, 81 percent were correct true positive alerts. A return-on-investment analysis showed an estimated average annual system benefit of $106,452 (2022-B01675). Statewide in Ohio, Bluetooth-based detection systems, coupled with flashing beacons activated by approaching school buses was found to be a cost-effective strategy to enhance safety at school bus stops (2018-B01251).
On-board security systems are becoming more accepted as preventative measures for crime on transit vehicles. In 2018, the International Association of Public Transport (UITP) released findings of a survey conducted on international trends in video surveillance on public transit. The international survey polled transit operators, public transportation authorities, and a small number of infrastructure managers. It found that between 2015 and 2018, the number of cameras per system grew by almost 70 percent. Public support for cameras grew from 65 to 73 percent from 2015 to 2018, while staff support remained steady at 78 percent. This growth in support is credited to improved perception of security (i.e., the presence of cameras deterring crime), perceived actual security (authorities using the camera footage to proactively solve problems), and to a lesser extent, fewer injuries and fatalities and less fare evasion (2023-B01790).
| Public support for surveillance cameras on public transit vehicles grew from 65 to 73 percent between 2015 and 2018. This was due primarily to increased perception of security as well as increased actual security. |
Transit signal priority (TSP) is a technology that improves the efficiency and reliability of bus routes in urban areas by utilizing on-board communications systems to request the traffic signal give the transit bus favorable signal timing. Research has shown that TSP improves bus speed and reliability, and emerging research may be providing evidence that it can improve bus safety as well. In Minneapolis, Minnesota, it was found that TSP helped to smooth bus driving behavior (less abrupt stops and deceleration) and likely improved bus safety (2021-B01520).
Costs
Understanding the costs of ITS technologies is crucial to helping transit agencies prioritize what deployments are suitable for solving their transportation safety problems given budget and other resource constraints.
A firm that tracks automotive sales and production trends examined the status of a camera-based blind spot detection warning system called Mobileye. As part of the SmartColumbus efforts, the technology was installed to improve safety in large cities where large vehicle collisions with pedestrians and bicyclists was a major problem. The cost of the technology ranged from $5,000 and $6,000 per vehicle to install (including all equipment and cabling) (2020-SC00469).
A camera-based collision avoidance system installed in Miami-Dade County cost $8,900 per bus, with $2,000 in installation costs per bus, and $6,900 in system hardware costs. Additionally, the system requires a recurring telematics subscription with a recurring cost of $240 per bus per year (2020-SC00465).
The enhanced pedestrian crossing warning system piloted in the Greater Cleveland area included an evaluation with a detailed cost breakdown of system costs. The entire system cost $359,441, and breakdowns of the system elements can be seen below in Table 1.
| Cost Element | Quantity | Total Cost |
|---|---|---|
| Bus Type 1 | 4 | $ 25,516.24 |
| Bus Type 2 | 4 | $ 25,282.04 |
| Bus Type 3 | 8 | $ 51,032.48 |
| Bus Type 4 | 8 | $ 50,375.20 |
| Intersection 1 | 1 | $ 82,768.17 |
| Intersection 2 | 1 | $ 71,771.52 |
| Intersection 3 | 1 | $ 52,695.53 |
| Total System Cost |
| $ 359,441.18 |
Best Practices
The FTA conducted the Pierce Transit Automated Collision Avoidance and Mitigation Safety Research and Demonstration project to research and facilitate development of collision avoidance warning systems (CAWS) and automated emergency braking (AEB) for transit buses. The project team researched and provided insight into challenges faced by transit agencies, bus original equipment manufacturers (OEMs), and technology developers intending to bring CAS technology to the transit bus industry. Lessons learned from this study include the following (2023-L01191):
- Although the business case varies from agency to agency, an agency seeking to implement CAWS/AEB systems should be able to estimate potential benefits using in-house data on collisions and expenses, as well as data provided by the vendors. Savings will depend on the proportion of casualty and liability (C&L) expenses resulting from collisions, and the fraction of the collisions that could be prevented or mitigated by CAWS/AEB.
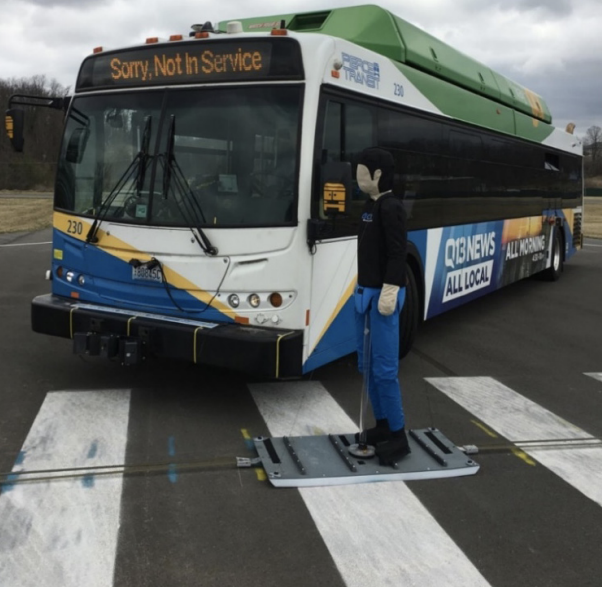
Figure 2: A bus stopping for a VRU mannequin (Source: Virginia Tech Transportation Institute). To mitigate risks and ensure a smooth project, have the agency staff adopt a go/no-go decision-making process that involves developing organizational structure, establishing discrete stages and decision points to advance the project, and agree on specific review activities beforehand.
- System retrofits may provide a challenge, as lidar sensors are line of sight devices that must be mounted to the front of the bus with unobstructed views of objects to be detected. The front of the bus may have limited areas of unobstructed views for sensor array mounts for retrofits.
- Highly reflective objects like road signs, reflective tape, and raised road reflectors may generate false positives (FPs) causing unexpected breaking. Sensor mounting adjustments and object detection algorithm improvements could mitigate this risk. Further down the road, additional sensor augmentation or fusion, such as computer vision, could further drive down FPs.
- Incorporate driver actions into CAWS/AEB reaction algorithms to avoid unnecessary warnings. For example, if a driver has anticipated a potential incident and initiated braking, a CAWS warning may not be necessary.
- Bus OEM participation was necessary for project success and should be agreed upon before project initiation. They provided engineering assessments as well as the approval of integrations.
- Establish “ground truth” for accuracy in FP and False Negative (FN) identification process. Collect randomly sampled events to avoid introducing error in measuring the system.
- Bus electrical power may be unstable. Power on the direct battery circuit could cut off unexpectedly in the middle of data and software uploads and downloads. It is recommended to use ruggedized automotive grade power regulators and to build robust operating systems capable of rebooting and restoring automatically.
Success Story
In 2019, New York City Department of Transportation, working with Metropolitan Transportation Authority, MTA New York City Transit, and MTA Bus Company, launched the Automated Bus Lane Enforcement (ABLE) on-bus camera program. New York City has over 150 miles of bus lanes that allow buses to bypass vehicular traffic. Keeping them clear not only helps buses reduce delays and arrive at stops on time, but also reduces risk of collisions between transit vehicles and other roadway vehicles [6]. As of April 2023, MTA has mounted cameras onto 450 buses and hopes to grow that number to 1,000 by the end of 2023. This would cover 80 percent of the city’s bus lanes [7].
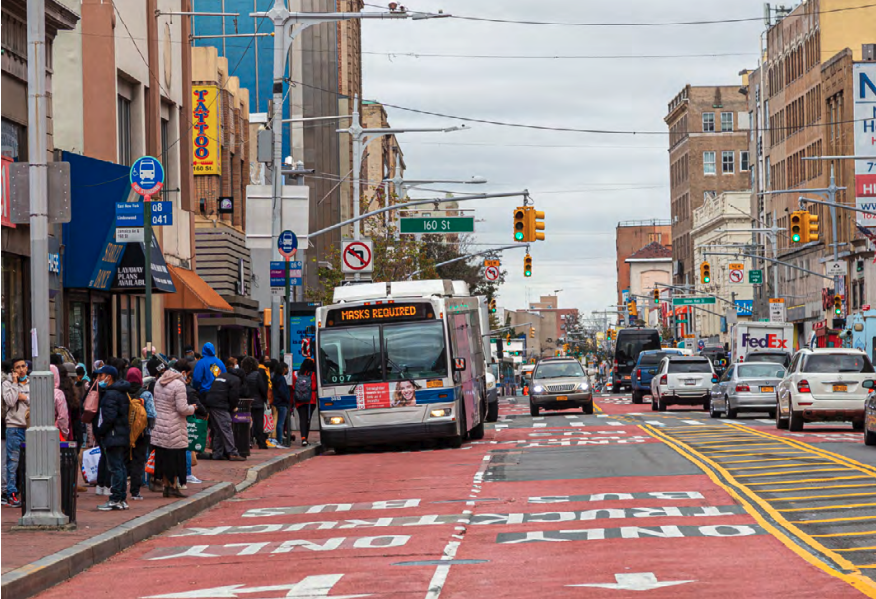
The ABLE cameras work by installing equipment at the front of buses to read the license plates of vehicles stopped in bus lanes. As the bus passes an offending vehicle, it uses GPS to mark the location. To issue a violation, two buses have to mark the same vehicle at the same location at least five minutes apart. This is meant to prevent issuing violations to vehicles making quick drop-offs using the bus lanes. After a violation is confirmed by two buses, notices of liability, which include the date, time and location of the violation, a photo of the vehicle recorded, and a link to view video of the violation, are sent out by NYC DOT to the New York City Department of Finance for adjudication [6]. For the first 60 days a bus route has ABLE cameras installed, drivers receive warnings and notice that enforcement will begin. After the first 60 days, an increasing fine structure goes into place, starting with $50 for a first violation and growing by $50 for each following violation in a 12-month period [8].
ABLE camera-based enforcement has been considered successful by policy makers and analysts. It not only resolves issues with bias and limited human resources for on-the-ground ticketing, but also changes driver behavior for the better. Evaluation shows that routes with ABLE have 5 percent faster bus speeds and 25 percent fewer crashes over the four-year period in which the program has been in operation. In one particular route, buses showed a 24 percent improvement in travel times, 14 percent more weekday riders, and an impressive 42 percent reduction in collisions. Repeat violations are very rare, indicating changes in driver behavior in parking in bus lanes. Eighty percent of violators only received one summons, and another 12 percent received no more than two [9]. In 2021, revenue collected from violations issued by on-bus cameras exceeded $4 million [6]. Because of the program’s success, the city is planning to expand enforcement to drivers who park in bus stops, truck loading zones, bike lanes, intersections, and crosswalks [7].
References
FTA, “National Transit Database - Safety & Security Time Series (Threshold Adjusted).” https://www.transit.dot.gov/ntd/data-product/safety-security-time-series-data.
FTA, “State Safety Oversight (SSO) Program.” https://www.transit.dot.gov/state-safety-oversight.
FTA, “Redesign of Transit Bus Operator Compartment to Improve Safety, Operational Efficiency, and Passenger Accessibility (Bus Operator Compartment) Program.” https://www.transit.dot.gov/research-innovation/redesign-transit-bus-operator-compartment-improve-safety-operational-efficiency
FTA, “Enhanced Transit Safety and Crime Prevention Initiative FTA Funding Sources Factsheet,” Nov. 30, 2022. https://www.transit.dot.gov/regulations-and-programs/safety/enhanced-transit-safety-and-crime-prevention-initiative-fta-funding.
FTA, “Fiscal Year 2022 Advanced Driver Assistance Systems (ADAS) for Transit Buses Demonstration and Automated Transit Bus Maintenance and Yard Operations Demonstration Program Project Selections,” Jun. 08, 2023. https://www.transit.dot.gov/funding/grants/grant-programs/fiscal-year-2022-advanced-driver-assistance-systems-adas-transit
New York City DOT, “New York City Bus Lane Camera Enforcement - 2022 Report,” 2022. [Online]. Available: https://www.nyc.gov/html/dot/downloads/pdf/bus-lane-camera-report.pdf
D. Colon, “Say Cheese! State Budget Lets MTA Bus Cameras Zap Bus, Loading Zone and Bike Lane Blockers,” Streetsblog New York City. [Online]. Available: https://nyc.streetsblog.org/2023/05/01/say-cheese-state-budget-lets-mta-bus-cameras-zap-bus-loading-zone-and-bike-lane-blockers
D. Colon, “Bus-Mounted Cameras Have Issued 40,000 Tix Since October,” Streetsblog New York City. Accessed: Oct. 11, 2023. [Online]. Available: https://nyc.streetsblog.org/2020/08/07/bus-mounted-cameras-have-issued-40000-tix-since-october
K. Duggan, “SMILE! Bus Lane Cameras Reduce Collisions, Speed Commutes, MTA Says,” Streetsblog New York City. [Online]. Available: https://nyc.streetsblog.org/2023/04/25/smile-bus-lane-cameras-reduce-collisions-speed-up-commutes-according-to-mta-stats


