2022 Executive Briefing
 BRIEFING HIGHLIGHTS
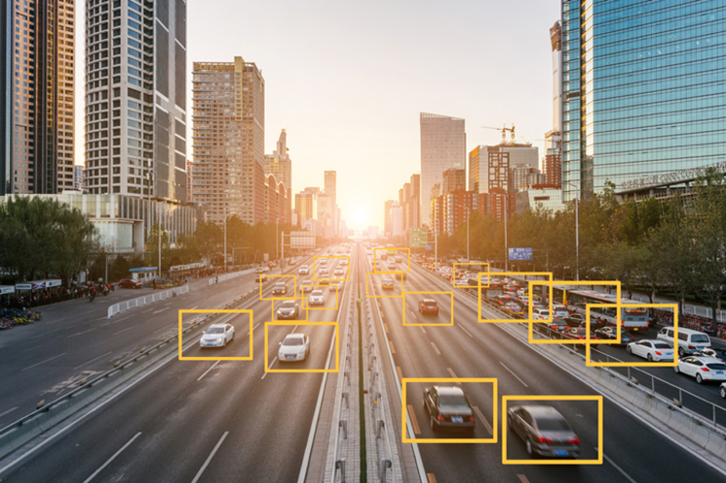
- Advancements in image processing and video analytics capabilities have resulted in multimodal data collection including for vulnerable road users.
- Real-time traffic data collection assists TMC operators with critical decision-making.
- Data collected from roadside ITS sensors and detectors are used in many safety and mobility applications (both real-time and offline).
Introduction
Intelligent Transportation Systems (ITS) continue to evolve at an unprecedented rate with advancements in information and communications-based technologies (ICT) such as hardware, software, and connectivity technologies. ITS offers promising solutions via numerous applications and use cases to help achieve the U.S. Department of Transportation’s (U.S. DOT) strategic goals, including improving system safety and mobility, providing sustainable transportation options, and enhancing overall system performance [1]. Sensors and detection technologies form the foundation of ITS applications. Advancements in sensor/detection technologies have enabled the generation and collection of large amounts of multimodal transportation data which serve as the building block of modern, data-driven ITS applications. Data from these sensors and detectors are used in both real-time operations applications, such as traffic management, parking management, adaptive signal control, adaptive ramp metering, automated fare collection systems, pedestrian conflict warning applications, etc. as well as passive or offline planning applications, such as traffic signal performance measurement.
This executive briefing will first discuss some of the advancements in roadway infrastructure sensors and detection technologies, the types of data collected, common ITS applications, and use cases. Table 1 shows traditional and emerging infrastructure-mounted sensors/detectors and associated ITS applications that are dependent on the data collected from these sensors. Subsequently, benefits, costs, and best practices associated with ITS sensors/detectors will be discussed followed by a success story.
| ITS Sensor / Detector | Types of Data Collected* | Example ITS Applications / Use Cases |
|---|---|---|
| Inductive loops, pneumatic road tubes |
|
|
| Radars, microwave radars |
|
|
| Magnetic sensors, magnetometers |
|
|
| Piezoelectric |
|
|
| Laser, infrared |
|
|
| Ultrasonic |
|
|
| Bluetooth/Wi-Fi |
|
|
| Weather sensors |
|
|
| Video/thermal cameras |
|
|
| Radio-frequency identification (RFID) |
|
|
* Additional processing may be required to convert raw input data from sensors/detectors into these data types
**Capable of detecting multimodal traffic counts including pedestrians and bicyclists
Advancements in ITS sensors, as shown in Table 1, have supported enhanced detection capabilities. These capabilities in combination with other technologies, such as Global Positioning System (GPS), LiDAR (Light Detection and Ranging), roadside units (RSUs), cloud/edge computing (AI/ML), etc., have allowed a plethora of ITS applications to emerge.
Benefits
Multimodal Data Collection

Traditionally, ITS sensors and detection systems have focused largely on the collection of motorized vehicle data. However, with advancements in sensing capabilities and AI/Machine Learning (ML), traffic data collection efforts have expanded to include other road user types, such as pedestrians and bicyclists. This has resulted in the development of several safety applications, such as camera-based pedestrian detection and alert systems (2021-B01611) and pedestrians in crossing warning systems (2022-B01675). A study conducted in Europe estimated that the mandatory deployment of vulnerable road user detection and warning systems using a variety of sensors on transit vehicles, including cameras and radars, can have a benefit/cost (B/C) ratio of 10.2 over a period of two years (2021-B01614).
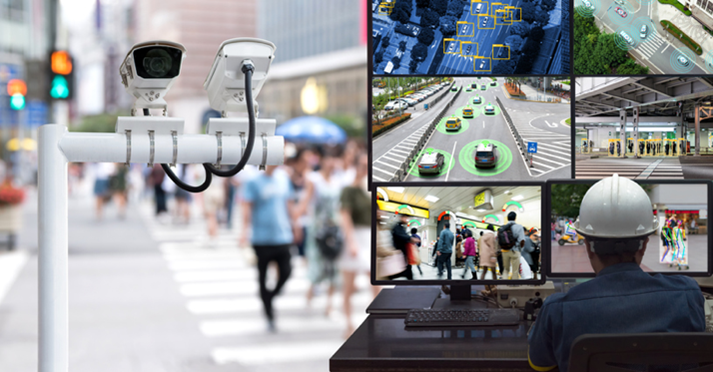
Data for Real-Time Decision-Making
Real-time data collected from ITS sensors enable traffic management centers (TMCs) and operators to engage in active traffic management, locate and respond efficiently to incidents, and inform the traveling public of hazardous conditions. For example, a wrong-way detection system pilot project in Phoenix, Arizona utilized thermal cameras to detect and alert wrong-way drivers much faster than traditional 911 calls (time savings of 1 minute and 38 seconds on average). 90 thermal cameras were deployed throughout the 15-mile stretch of the I-17 corridor to detect and track wrong-way drivers. Data collected over a two-year period revealed that out of 109 wrong-way identified vehicle incursions, 88 percent of drivers self-corrected on an exit ramp (2022-B01618). Another AI-based roadway safety and work zone detection system uncovered 20 percent more crashes than previously reported and reduced law enforcement’s crash response times by 9-10 minutes on average in Nevada. The AI platform utilized real-time data from a variety of ITS roadside infrastructure sensors, in-vehicle navigation devices, and a smartphone navigation app. Additionally, real-time data enabled predictive analytics to help identify areas that were at high risk for collisions, dangerous driving conditions, and traffic congestion (2022-B01642).
Offline Predictive and Analytical Engines
Enormous amounts of traffic data, such as speed, congestion, traffic volume, and incidents are being generated by roadway sensors. These data are collected via field devices, such as controllers and cabinets, and are sent to TMCs for cleaning, processing, and storage. While some of these data are used for real-time decision-making as well as offline analytics, a large quantity often remains on servers without being used. Recent advancements in data analytics and AI/ML have shown promising results in putting these historical or archived raw data to new use. For example, a statewide inclement weather forecasting model in Montana utilized historic data collected from RWIS sensors in combination with drone-based ice detection technology to improve forecasting accuracy. The data were collected and stored in a cloud database enabling web-based automatic data analysis for all the RWIS sites. The prediction models utilizing historic data improved the accuracy of average hourly ice forecasts from 62 to 82 percent, ensuring that de-icing activities took place during winter season more effectively and thereby reducing the possibility of vehicle crashes (2022-B01688). In another example, an AI-based traffic management pilot program in Las Vegas, Nevada utilized data from existing cameras, roadside sensors, and other traffic-related data to develop predictive analytics to recognize traffic patterns, which enabled traffic management professionals to implement timely countermeasures. Data collected during a one-year pilot program indicated that AI and deep learning strategies resulted in an around 17 percent reduction in primary crashes along Interstate 15 and also reduced emergency response time by up to 12 minutes (2020-B01507). Another study indicated the benefits of AI-based machine-vision algorithms and advanced analytics to identify collision near-misses, classify road user types, and detect speeding/lane violations in Bellevue, Washington. The study utilized video footage from a network of high-definition traffic cameras installed by the city (2022-B01617).
Operations and Management Applications
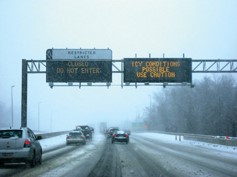
Many safety and mobility applications have been deployed that rely on data collected from ITS sensors. For example, in Minnesota, a Dynamic Message Sign (DMS) displaying weather alerts based on the data collected from RWIS sensors, cameras, and friction sensors was associated with a statistically significant reduction in average speeds by 3.5 mph and 85th percentile speeds by 2.9 mph in the eastbound direction of the US 12 corridor. Temporary traffic sensors were installed upstream and downstream of the DMS location to gather data to assess the effectiveness of DMS-based weather alerts (2022-B01680). Additionally, several states have deployed statewide Truck Parking Information and Management Systems (TPIMS) across multiple rest areas to provide real-time parking availability information to the truck drivers. Parking detection systems include video-based occupancy detection as well as in-pavement sensors like magnetometers and radar-based detections. For example, TPIMS deployment results from a study in Colorado indicated a B/C ratio of 7:1 (2018-B01256). In Minnesota, 67 percent of truck drivers indicated that the availability of real-time truck parking information resulted in their improved ability to find a parking spot (2019-B01340).
Costs
Table 2 shows various ITS detection systems, their associated capital costs, operations and maintenance (O&M) costs, types of sensors/detectors utilized, and their corresponding hyperlinked examples. The costs represented in Table 2 are for the detection systems comprised of various ITS sensors and detectors and are highly dependent on the location, types and number of sensors/detectors employed.
Table 2 shows various ITS detection systems, their associated capital costs, operations and maintenance (O&M) costs, types of sensors/detectors utilized, and their corresponding hyperlinked examples. The costs represented in Table 2 are for the detection systems comprised of various ITS sensors and detectors and are highly dependent on the location, types and number of sensors/detectors employed.
| Detection System | Sensors and Detectors | Capital Costs | Yearly O&M Costs | Notes |
|---|---|---|---|---|
| Pedestrian and bicycle detection system | Passive infrared, inductive loops | $5,820 | $10,000 | Per site |
| Pedestrian and bike counters | Infrared, inductive loops, piezoelectric, pneumatic tubes, and camera | $21,600 | $3,400 | Sidewalk and bike lane counters, per site |
| Ramp signal video detection system | Thermal cameras | $10,500 | $7,000 | Thermal camera costs $2,800 per unit |
| Machine vision-based blind spot warning system | Camera | $5,000 – $6,000 | - | Installation cost per equipped vehicle (buses) |
| Camera vision-based collision avoidance system | Camera | $8,900 | $240 | System hardware cost per bus |
| Work zone intrusion alert system | Radar, LEDs | $6,600 - $31,000 | $1,200 | Per work zone area |
| Road weather information system (RWIS) | RWIS sensors | $50,000 - $60,000 | $2,600 –$4,600 | Per new weather sensor location |
| Vehicle detection system | Microwave detectors | $45,845 | $1,908 | Per device per year |
| Wrong-way detection system | Radar, camera | $18,000 - $45,000 | - | Per site |
| Truck parking information system | Magnetometers, microwave radars, video cameras | $2,000 - $30,000 | $200 – $1,200 | Per truck parking space (private and public rest areas) |
Table 3 below shows example individual sensor/detector costs from a study published by the North Carolina DOT in 2021 (2020-SC00469).
| Sensor Type | Sensor Cost |
|---|---|
| Active Infrared | $200-$7,000 |
| Passive Infrared | $2,000-$4,550 |
| Laser | $8,000 |
| Micro-wave Radar | $5,000 |
| Inductive Loop | $2,500-$4,300 |
| Magneto-meter | $490-$540 |
| Piezo-electric | $4,400 |
| Pneumatic Tube | $2,200-$2,800 |
| Thermal Camera | $4,800 |
| Depth Camera | $9,900-$12,330 |
Best Practices
The choice of technology in solving a particular problem is of common interest. As with any technology, there are strengths and limitations in using different ITS sensors and detectors. Some ITS sensors may work effectively for one type of application but may not be the best choice for others. Furthermore, some ITS sensors have more intrusive installations (e.g., in-pavement sensors) than others but may yield more accurate traffic data collection results. Conversely, other sensors can be mounted on the roadside infrastructure but may not yield as accurate results. Often, several sensors/detectors may be used in combination to generate and/or collect the needed inputs for data-driven ITS Applications. Example best practices from recent deployments are summarized below:
- According to a study in North Carolina (2021-L01074), pneumatic tubes for bicycle detection and counting applications have yielded high system accuracy and low equipment installation costs. The study also recommended the use of passive infrared detectors for counting both pedestrians and bicycles. Another study in Louisiana utilized a video-based automated pedestrian and cyclist counting system. It suggests maintaining accuracy of cameras by accounting for varying circumstances (e.g., different light intensities, video time periods, motion patterns, etc.) and adding pedestrian and cyclist tracking to the algorithm for counting (2021-L01070). Another study in South Carolina suggests using thermal cameras to detect pedestrians in dark non-lit areas, as they can outperform CCTV night vision under conditions with low to no light (2021-L01076).
- A study in Illinois revealed that travel-time prediction models were more accurate using occupancy data from loop detectors when compared to other traffic variables collected and that particular attention should be paid to malfunctioning loop detectors. This study suggested fusing traffic data from multiple sources to improve the accuracy of traffic prediction models (2022-L01136). Another study in Utah suggested that using data filtering techniques such as Kalman Filtering on loop detectors that report traffic flow and occupancy data improves the accuracy of queue length and wait time predictions that employ these data (2022-L01134).
- A study conducted in New York City suggested employing quartz weigh-in-motion sensors rather than traditional piezoelectric sensors for more reliable and accurate data collection (2022-L01125).
- Reducing data latency is of extreme importance for many real-time applications. A study in Iowa on a computer vision-based wrong-way detection system suggests determining the number of traffic cameras needed by analyzing data processing delays to balance system performance and costs. It also suggests considering cloud computing options for better data storage and faster analysis, thus reducing latency issues (2022-L01110).
- A freeway ramp metering application in California suggests keeping the loop detection health close to 100 percent and data quality at 90 percent or above at critical locations for successful operation of congestion-responsive freeway ramp metering strategies (2022-L01107).
Success Story
| Leveraging existing ITS infrastructure such as CCTV cameras (video feeds) and using computer vision algorithms to process the subsequent data enables real-time object detection for different use cases, is cost effective, and is easily adaptable to other cities or states. |
Researchers at the Connected Cities for Smart Mobility towards Accessible and Reliable Transportation (C2SMART) University Transportation Center developed a continuous, real-time pedestrian and bicyclist detection framework that leverages existing ITS infrastructure and computer vision [7]. Researchers used public CCTV traffic camera feeds and deep-learning-based video processing to analyze sidewalk and roadway densities. This framework allowed researchers to capture critical data on pedestrian, bicyclist, and vehicle densities without any additional infrastructure investment. Many innovative detection technologies require investment in new devices or infrastructure such as LiDAR or thermal sensors. In this project, video feeds (traffic data) from existing CCTV cameras in New York City (NYC) were used to detect multimodal road users with an emphasis on pedestrians and bicyclists.
This approach offered a cost-effective, low-risk solution for data collection and analysis for decision makers. The low-resolution nature of existing CCTV camera feeds and conversion of vehicles, pedestrians, and bicyclists into untraceable objects helped preserve the road users’ privacy. Because the project relied on pre-existing deployed ITS infrastructure, the estimated 3-year system deployment cost for a proposed pedestrian detection system with 68 cameras ranged from $500 to $1700 per year, depending on whether the data are being stored on local servers or on the cloud.
References
- U.S. DOT, “U.S. DOT Strategic Plan FY 2022-2026 ,” 07-Apr-2022. [Online]. Available: https://www.transportation.gov/mission/us-dot-strategic-plan-fy-2022-2026. [Accessed: 11-Nov-2022].
- B. Hanson, “ITS Professional Capacity Building Program - ITS EPrimer - Module 9: Supporting ITS Technologies,” 2014. [Online]. Available: https://www.pcb.its.dot.gov/eprimer/module9.aspx.
- Institute of Transportation Engineers, “Signal Detection for Bicycles .” [Online]. Available: https://www.ite.org/technical-resources/topics/complete-streets/bicycle-signals/signal-detection-for-bicycles/. [Accessed: 30-Nov-2022].
- National Association of City Transportation Officials (NACTO), “Signal Detection and Actuation, Urban Bikeway Design Guide.” [Online]. Available: https://nacto.org/publication/urban-bikeway-design-guide/bicycle-signals/signal-detection-and-actuation/. [Accessed: 30-Nov-2022].
- Colorado DOT, “Non-Motorized Monitoring Program Evaluation and Implementation Plan,” 2016. [Online]. Available: https://www.codot.gov/programs/bikeped/documents/nmm_toolkit.pdf.
- J. Guerrero-Ibáñez, S. Zeadally, and J. Contreras-Castillo, “Sensor Technologies for Intelligent Transportation Systems,” Sensors, vol. 18, no. 4, p. 1212, 2018. https://doi.org/10.3390/s18041212.
- U.S. DOT, “Leveraging Existing Infrastructure and Computer Vision for Pedestrian Detection,” ITS Deployment Evaluation. [Online]. Available: /sites/default/files/2022-03/case-study/Pedestrian%20Detection%20Case%20Study_FINAL_508_PDF.pdf.

