2019 Executive Briefing
BRIEFING HIGHLIGHTS:
- Archived data provides information about the traffic system not previously available and enables analyses of problems and solutions not possible with more static or less detailed traditional data.
- The ability to do before/after studies opens new possibilities as far as measuring, monitoring and evaluating the performance of systems and new infrastructure projects.
Introduction
Intelligent transportation systems collect large amounts of data on the operational status of the transportation system. Archiving and analyzing this data can provide significant benefits to transportation agencies.
Archived data management systems (ADMS) collect data from ITS applications and assist in transportation administration, policy evaluation, safety, planning, program assessment, operations research, and other applications. Small-scale data archiving systems can support a single agency or operations center, while larger systems support multiple agencies and can act as a regional warehouse for ITS data.
The 2012 transportation reauthorization law Moving Ahead for Progress in the 21st Century (MAP-21) has set up new requirements for performance-based transportation decision making, including establishing performance measures and targets in seven national goal areas such as congestion reduction and system reliability. Public agencies are seeking real time and archived data to provide metrics and measurements of system performance.
Example uses of archived ITS data include:
- Incident management programs may review incident locations to schedule staging and patrol routes, and frequencies for service patrol vehicles.
- Historical traffic information can be used to develop predictive travel times for both everyday travel and special events.
- Transit agencies may review schedule performance data archived from automatic vehicle location, computer-aided dispatch systems and/or automatic passenger counting systems to design more effective schedules and route designs, or to manage operations more efficiently.
As information management and data archiving systems evolve, they are moving from archiving information from a single source or system to more complex implementations. In order to provide support for regional operations across jurisdictional and agency boundaries, data fusion from multiple sources and/or agencies, integration of both real-time and archived information, and data visualization are being incorporated.
Information management and data archiving from both infrastructure and mobile sources in data systems are also the foundation of the Enterprise Data Program of the ITS Research Program.
The collection and storage of data on transportation system performance often occurs at transportation management centers (TMCs). The transportation management centers chapter discusses TMCs in detail. In addition, the transit management chapter discusses the archiving and use of transit performance data.
Benefits
Data archiving enhances ITS integration and allows for coordinated regional and local decision making. Traffic surveillance system data, as well as data collected from commercial vehicle operations, transit systems, electronic payment systems, and road weather information systems have been the primary sources of archived data available to researchers and planners. Often the benefits of the archived data systems are not easily quantified. The archived data provides information not previously available and enables analyses of problems and solutions not possible with more static or less detailed traditional data. As more advanced data analysis techniques develop - and the efficiency of data reporting systems are improved, additional information management must be developed. examples of the effectiveness of information management systems will become available. Methodologies for computing the benefits of information management must be developed.
| ITS Goal | Selected Findings |
|---|---|
| Customer Satisfaction | In Virginia, a web-based archived data management system (ADMS) was deployed to provide decision makers and other transportation professionals with traffic, incident, and weather data needed for planning and traffic analyses. An assessment of website activity indicated that 80 percent of the website usage was devoted to downloading data files needed to create simple maps and graphics. Overall, users were pleased with the ability of the system to provide a variety of data, but wanted more information on traffic counts, turning movements, and work zones, as well as broader coverage (2008- 00560). |
| Efficiency | The Weather Responsive Traveler Information (WRTM) project in Michigan presented the opportunity to tie multiple systems together, offering enhanced functionality and providing benefits by offering automated messages for weather-related events. The use of the WRTM System resulted in statewide decrease of user delay costs of between 25 and 67 percent during National Weather Service Advisories and Warnings (2017-01145). |
| Efficiency | In Dallas, Integrated Corridor Management (ICM) Transit Vehicle Real-time Data Demonstration Evaluated the ability to collect and transmit transit location and passenger loading data to transit management centers and other ICM systems. This system ability to use data in real time decision support lead to decisions to supplement bus service during peak periods, advertising train capacity in event of traffic accident or heavy traffic, and reduction of train capacity (removing cars) in real-time during low demand all which improved the overall system efficiency for users (2016-01067). |
| Productivity | The Iowa Department of Transportation found that a project to make data reporting and analysis tools available to local law enforcement organizations resulted in an increase in officer-generated crash reports received electronically from 68 percent from 47 percent, allowing the agency to provide statewide crash data on a quarterly basis. At the beginning of the project, the available data was 1.5 to 3 years old (2013- 00882). |
| Productivity | A study using archived data at five study locations with a variety of seasonal traffic patterns found that in some situations, up to 75 percent of all days can be missing data at urban locations when calculating annual average daily traffic statistics with archived ITS data. This finding challenges conventional procedures for the calculation of annual average planning statistics (2013-00873). |
| Productivity | In New York City, research to assess the effect of real-time information provided via web-enabled and mobile devices on public transit ridership information yielded a median ridership increase of 2.3 percent on the most popular routes in New York (2018-01235). |
| Safety | Research out of Virginia Tech focused on the development and subsequent evaluation of an in-vehicle Active Traffic and Demand Management (ATDM) system deployed on I-66, an interstate running west from Washington, D.C into Northern Virginia. Data was collected from hardware in the instrumented vehicle, including four in-vehicle cameras, a Data Acquisition System (DAS), an on-board equipment (OBE), and a Differential GPS (DGPS). Key finding from the research showed that the alerts changed participants behavior to be more likely to travel at speed limits and reduced the number of glances to instrument cluster while having 73 percent of the participants be in factor of the technology (2016-01099). |
Best Practices
Research conducted by the Transportation Research Board (TRB) Transit Cooperative Research Program (TCRP) on the increasing trend of open data provided a synthesis of the current state of the practice and policies in the use of open data for improved transit planning; service quality, customer information, and customer experience; implications of open data and open documentation policies; and their impact on transit agencies and public support. The research concluded that open transit data provides positive impacts in increased transparency, better visibility of provided public services, easier use of the transit system, increased return-on investment (ROI) of existing web services and supports the foster of innovation (2019-00866).
Among the key lessons learned provided by the report are:
- Maintain data quality and accuracy is critical to success but, requires work. Quality checks need to be in place when opening data. Start small and work to larger data sets to reduce costs. It is important to have good clean data so external users will understand and use it.
- Plan for open data costs. More than threequarters of respondents reported that staff time is required to update, fix and maintain the data and almost 70 percent reported that internal staff time is required to convert the data to an open format. Use Standards where possible to make it easier to provide the data.
- Determining open data costs is difficult. Almost 90 percent of respondents indicated they cannot quantify time spent on open data activities. Internal cost by agencies on open data work is not directly tracked by staff and even software support costs are rarely tracked. About 95 percent of respondents could not identify the actual costs of the work and only one agency reported a monthly cost of $1,500.
- Determine the benefits of open data. More than 75 percent of respondents reported open data increased their awareness of services and about 75 percent reported that it empowered their customers and encouraged innovation outside of the agency. Other benefits included opportunities for private businesses, encouraged innovation internally, improved market reach, and increase ROI on web services.
- Engage and develop relationships with developers and users. Early engagement with potential users is key. Find out what they want and how they want it. Try and track who is developing what, particularly to understand the successes and failures; More than two-thirds of respondents stated that they engaged or have dialogues with existing and potential data users with the open data. This provided feedback on data anomalies and quality, allowed the data to be exposed to wider audiences, and explore the demand for the data.
Case Study
Using Regional Archived Multimodal Transportation System Data for Policy Analysis
METRANS Transportation Center is a joint partnership of the University of Southern California (USC) and California State University Long Beach (CSULB).
As one of the most congested areas in the country and a center for international trade and immigration, the Southern-California region has one of the largest transit-dependent populations in the country. METRANS’ mission is to foster independent, high quality research to solve the nation's transportation problems; train the next generation of transportation workforce; and disseminate information, best practices, and technology to the professional community.
With funding secured from Los Angeles County Metropolitan Transportation Authority (Metro), METRANS owns and operates an ADMS which archives historical highway, arterial and public transit system performance data from Regional Integration of Intelligent Transportation Systems (RIITS), which includes data from Metro, Caltrans, City of Los Angeles Department of Transportation (LADOT), California Highway Patrol (CHP), Long Beach Transit (LBT) and Foothill Transit (FHT). The vast database includes data from roadway traffic sensors, CCTV video feeds, on-board AVL units, transit passenger counters and accident reports.1
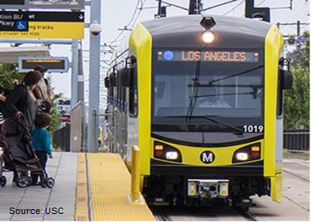
A research team from USC’s Price School of Public Policy wanted to apply these data sources to urban planning by utilizing the ADMS archives to analyze the impact of the capital investment in the Phase 1 addition of the LA Metro Expo Line. The Expo Line project was touted by officials as an investment that would improve mobility of residents and employees and increase transit mode share, all while alleviating congestion. The team was most interested in the effect the rail project had on local freeway and arterial system performance, stating that while transit investments are often promoted as a way to reduce congestion, there is very limited literature on the examined impacts of new rail lines on traffic.
For the study, data pulled from geo-located sensors along the I-10 Freeway and arterial roads over a three-month “pre- Expo Line” period that lasted from November 2011 to January 2012 was compared against three months of “post-Expo Line” data that was collected from November 2012 to January 2013 [1].
The team used close to 1 million records from freeway sensors and almost 16 million from arterial road sensors. The researchers found that the records revealed that the Expo Line had little, if any, impact on local arterial or freeway congestion. It did, however, initiate a significant overall rise in transit ridership across the Culver City-Downtown Los Angeles corridor along the Expo Line.
“Unlike many transportation agencies where data is collected for real-time operations and disposed of, METRANS ADMS archives this data in a systematic fashion to facilitate effective decision making using predictive data. (Note this call out is already used in the previous version.) ” - USC |
The USC team was awarded the 2017 Chester Rapkin Award by the Association of Collegiate Schools of Planning (ACSP) for the work described in their paper “Using Regional Archived Multimodal Transportation System Data for Policy Analysis: A Case Study of the LA Metro Expo Line” [2]. Those involved with the project hope that the findings outlined in their report help transit planners design better projects that increase transit patronage and meet objectives or expectations.
Regarding the power of Big Data in transportation, the Southern California region is one of the first areas in the country that are systematically storing real-time data sets in this manner. The ability to do before/after studies opens new possibilities as far as measuring, monitoring and evaluating the performance of systems and new infrastructure projects. One notable application is with predictive route planning. Most existing route-planning algorithms operate on “detect and avoid,” however with a data archive such as METRANS’, agencies can “predict and avoid,” allowing them to plan their schedules better. This manner of utilizing predictive data for effective decision making is all a part of the process to transition Los Angeles to a Smart City.
Secure Data Commons Platform

One of the challenges with the collection of sensitive transportation data involves balancing how to utilize the data to improve public services while also protecting the data. Current approaches to securing or de-identifying such data severely limits its access or even destroys valuable information. Sensitive data could expose Personal Identifiable Information (PII) such as location, time and other data and can also include proprietary information, financial information, security information, and other sensitive information that must be protected and secured [3].
To protect this type of information, the data is either never shared or the sensitive data is removed from the full data set using a scrubbing process to ensure that no other groups can gain access to that sensitive data or use other data sources to reproduce the data. The sensitive data scrubbing process must also be very thorough and often times requires the full removal of several key data elements, limiting the amount of data to a single given map location which can limit its use for a broad range of research purposes.
To address this challenge, in 2018 the ITS JPO developed a proof of concept Secure Data Commons Platform, or the SDC. The SDC is a cloud-based analytics platform that enables secure access to traffic engineers, researchers, data scientists to various transportation related restricted datasets. The SDC’s objective is to provide a secure platform that enables USDOT and the broader transportation sector to share and collaborate their research, tools, algorithms, analysis, and more around sensitive datasets using modern, commercially available tools without the need to install tools or software locally.
SDC Primary Objectives
- Ensure that sensitive data is protected through implementation of USDOT Information Technology (IT) security standards
- Enable scalable data storage, data analysis and user access protocol via cloud-based platforms
- Leverage cloud capabilities to share complex (high volume, velocity and/or variety) transportation datasets with the transportation research community
- Provide authorized access to users through a data use agreement with revocable access terms to protect the sensitivity of data
- Provide users with predefined data analysis tools and encourage custom toolsets and open sharing of code and added datasets amongst the user community
The SDC meets the needs of both data providers needing a location to help collect and store their sensitive data and transportation data researchers who would like access to the data to do their analysis. Data Providers looking to use the SDC have the ability to upload their data directly into the platform in near real-time using automated tools. Data Providers have complete control over who can access their data and metadata. Data within the system cannot be copied or exported out to ensure that no one can remove the data and release it. Additionally, any exports of analysis of the datasets much be authorized by the data provider prior to be release.
“Currently, the SDC is being used by the ITS JPO Connected Vehicle Pilot Deployment Program to store the data from all three sites (New York, Tampa, and Wyoming) to allow independent evaluators and other researchers to perform analysis on the data.” - USDOT |
Subject to being approved by the data provider, transportation data researchers can access raw, curated and published datasets along with modern commercial data analysis tools and a method to share their research with others.
- Raw datasets are in the native or original format of the data – unaltered by any cleaning or quality control.
- Curated datasets are processed for quality and are standardized to increase the usability.
- Published datasets are shared by other researchers and provide additional insight into the data with algorithms and potential other datasets.
Currently, the SDC is being used by the ITS JPO Connected Vehicle Pilot Deployment Program to store the data from all three sites (New York, Tampa, and Wyoming) to allow independent evaluators and other researchers to perform analysis on the data. The system also houses Waze data under the Connected Citizen Program under which Waze is partnering with various international government agencies to share incident and road closure data.
References
- Rhoads, Mohja. “Using ‘Big Data’ for transportation analysis: A case study of the LA Metro Expo Line.” Transportation Research and Education Center, Portland State University, October 9, 2014. https://www.slideshare.net/otrec/expo-ppt-portlandoct-2014.
- Kredell, Matthew. “Price study on Expo Line’s traffic impact wins planning journal’s best paper award.” USC Price News, November 10, 2017. https://priceschool.usc.edu/price-study-on-expo-linestraffic-impact-wins-planning-journals- best-paperaward/.
- Gold, Ariel. “Secure Data Commons: Accelerating Innovation through Collaboration.” Waze Partner Summit, October 17, 2017. https://its.dot.gov/presentations/2017/Waze_Part ner_Summit20171017.pdf.


