A quick glance at benefits from variable speed limit deployments and simulations around the United States.
WHAT ARE VARIABLE SPEED LIMITS?
Active traffic management (ATM) is the ability to dynamically manage
recurrent and non-recurrent congestion based on current and predicted
traffic conditions [1]. Variable speed limits (VSLs), a key component of ATM, adjusts posted speeds to reduce speed variance, enhance safety, and lower the likelihood of secondary crashes. By smoothing traffic flow and helping drivers respond to queues, bottlenecks, or adverse weather, VSLs support the overall goal of ATM through improving roadway performance and reliability [2].
EXAMPLE VARIABLE SPEED LIMIT USE CASES AND BENEFITS
Click on each use case below from recent ITS for VSL deployments and simulations, based on ITS project evaluations contained in the ITS Deployment Evaluation Databases.
| Use Case | Example Benefit | |
|---|---|---|
 | Crash Reduction | A before-and after study of freeway VSL deployment in Georgia and Wyoming reduced crashes by an estimated 34% and 29%, respectively. |
 | Winter Weather Conditions | After implementing VSL during a winter season on a section of I-90 in Ohio, crashes during snow events declined by 42% and travel delay decreased by approximately 83%. |
 | Ramp Metering | A combined VSL and ramp metering (RM) algorithm using Georgia Department of Transportation (GDOT) data was estimated to reduce total travel time by about 8% for the I-285 corridor in Atlanta, Georgia. |
 | Severe Crash Reduction | Deploying VSL along a section of I-95 in Virginia produced an estimated annual benefit of approximately $2.57 million, attained primarily from reduction in severe crashes. |
 | Dust Storms | After deploying a dust-detection system in Arizona on a 10-mile corridor along I-10, average vehicle speed was reduced to 45 miles/hour. |

Crash Reduction
PROBLEM
Static speed limits often fail to reflect changing traffic, weather, or incident conditions, which can lead to unsafe speed differences between vehicles, unexpected slowdowns, and an increased risk of crashes. VSLs provide dynamic, real-time speed adjustments to help smooth traffic flow, reduce congestion and improve safety when conditions worsen.
CONTEXT
Wyoming DOT deployed VSL on a rural freeway corridor to improve safety and reduce closure frequency. Georgia DOT installed VSL along a freeway corridor to harmonize traffic flow and increase throughput.
BENEFITS
Freeway VSL installations had an estimated crash reduction of 34% in Wyoming and 29% in Georgia. In Georgia, the estimated crash modification factors for total, daytime, and rear-end crashes were 0.708, 0.728, and 0.648, respectively (2022-B01653).
| VSLs ”are used for three primary functions that improve safety and operations: reducing congestion, reducing speeds during inclement weather, and managing speeds during traffic events, such as work zones or incidents [3].” |
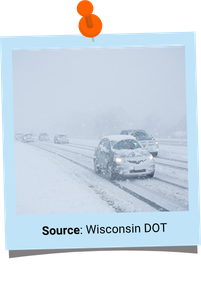
Winter Weather Conditions
PROBLEM
On Interstate 90 in Ohio near Lake Erie, drivers often experience low
visibility and white-out conditions in the winter due to lake-effect snow.
These hazardous conditions combined with high speeds have caused
hundreds of crashes often resulting in road closures and long delays.
CONTEXT
Using a Transportation Systems Management and Operations (TSMO)
approach, Ohio DOT (ODOT) implemented VSL based on real-time road and weather conditions in order to improve safety during hazardous winter events.
BENEFITS
| “Interest in establishing a permanent VSL corridor grew as local agencies and motorists discussed the safety of the corridor [4].” |
ODOT conducted an analysis of winter season crash and incident data before and after the VSL deployment. Total crashes have decreased by 22%, and travel delay has decreased by approximately 83%. The incident clearance times have also been reduced by an average 31 minutes (2021-B01568).
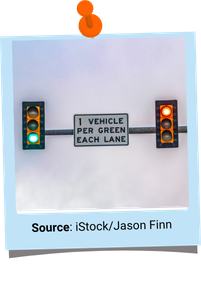
Ramp Metering
PROBLEM
Freeway corridors experience significant congestion during peak
periods, specifically at merge bottlenecks, which reduces capacity and increases travel times. Existing strategies using ramp metering, (RM) alone are not fully optimized to reduce congestion in real time.
CONTEXT
A study developed a combined VSL and RM algorithm, using real-time traffic data from GDOT and simulation based optimization to control freeway speeds and ramp access. The overall goal was to minimize total travel time on the I-285 corridor.
BENEFITS
| ”The performance of the VSL-RM control with optimized parameters outperforms the RM control only model with its optimized parameters in terms of reducing total travel time [5].” |
The combined VSL-RM control approach was estimated to reduce the
total system and freeway travel times by 8% and 8.5%, respectively. The
algorithms effectively delayed the bottleneck formation time and
lessened the severity of the bottleneck (passing speed) (2023-B01724).
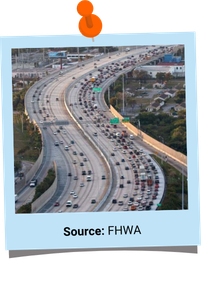
Severe Crash Reduction
PROBLEM
The I-95 corridor in Virginia suffers from high traffic volumes and densities, especially on summer weekends, leading to frequent congestion, delays and crashes. Traditional traffic management strategies have been insufficient to maintain safe, consistent speeds.
CONTEXT
VSLs help generate smoother traffic flow and consistent travel speeds along the corridor. The Virginia DOT (VDOT) deployed 48 light-emitting diode (LED) VSL signs on I-95, spaced about 0.6 miles apart, to better manage weekend congestion from recreational travel.
BENEFITS
One year of crash data from before and after VDOT deployment showed a 13% reduction in fatal and injury crashes, which produced an annual benefit of approximately $2.57 million (2025-B02005).
| “Results show that drivers responded to the VSLs, and that mean speeds and speed distributions changed during transitional flow states [6].” |

Dust Storms
PROBLEM
Arizona experiences frequent and intense dust storms, which creates sudden drops in visibility, leading to dangerous driving conditions and crashes. These conditions make it unsafe to maintain normal speeds, increasing the risk of vehicle crashes.
CONTEXT
The Arizona DOT, the Arizona Department of Public Safety and the National Weather Service staff developed a dust-detection system to better equip drivers to drive in dust storms. The dust-detection technology included overhead message boards, VSL signs, closed circuit cameras, and shortrange detectors for blowing dust.
BENEFITS
| “There was one 20-minute event that provided measurable data. At one point during that storm, visibility dropped to less than 300 feet, triggering the speed limit to drop to 35 mph, which happens incrementally [7].” |
By utilizing VSLs to automatically change the speed limit from 75 miles per hour to 35 miles per hour during dust storms, the average vehicle speed reduced to 45 miles per hour (2024-B01904).
SAMPLE COSTS: VARIABLE SPEED LIMITS
| $52,000 for Seven VSL Signs | A smart work zone (SWZ) system implemented during an interchange reconstruction project on I-35 in Kansas cost approximately $1.65 million. Out of the $1.65 million, 7 units of VSL signs cost $52,000 and 18 units of variable message trailers cost $279,000 (2021-SC00477). |
| Portable VSL Daily Cost is Between $173 and $329 | Utah DOT (UDOT) implemented dynamic management of portable variable speed limit (PVSL) technology to reduce regulatory speed limits through a work zone. UDOT rented the necessary equipment for a PVSL system for an average daily cost of between $173 and $329 (2018-SC00404). |
| $91,000 to $180,000 for VSL System Installation | In Texas a VSL pilot program was implemented at an urban congestion site, construction work zone site, and a weather-related site. The capital costs to install temporary VSL systems in Texas ranged from $91,000 to $180,000 (2016-SC00365). |
DISASTER AND EXTREME WEATHER LESSONS LEARNED
 | Field tests of Variable Speed Advisory (VSA), an ATM strategy, were conducted under the lead of California DOT (Caltrans) in San Diego, where multiple lessons were learned (2021-L01055): 1. VSA deployment should use larger and more prominent signs, for better viewability for drivers. 2. The distance between two consecutive VSA signs should be about 0.4 to 0.5 miles apart, but not greater than one-half mile. |
 | In Texas, a VSL pilot program was implemented at an urban congestion site, construction work zone site, and a weather-related site. The primary lessons learned from the pilot are detailed below (2017-L00780): 1. Use permanent equipment preferably mounted over travel lanes, as temporary equipment is not suitable for long-term operations. 2. Fully understand existing speed profiles and ingress/egress characteristics on the corridor to ensure proper spacing for VSL systems. 3. Conduct significant and on-going public outreach to assist drivers with understanding and complying with VSLs. |
REFERENCES
“Federal Highway Administration. ”Active Traffic Management: Approaches: Active Transportation and Demand Management - FHWA Operations” Aug. 2023. [Online]. Available: ops.fhwa.dot.gov/atdm/approaches/atm.htm .
Federal Highway Administration. “Variable Speed Limits | FHWA.” [Online]. Available: https://highways.dot.gov/safety/proven-safetycountermeasures/variable-speed-limits
Avelar, R. E., Park, E. S., Ashraf, S., Dixon, K. K., Li, M., & Dadashova, B. “Developing crash modification factors for variable speed limits” May 2021. [Online]. Available: https://rosap.ntl.bts.gov/view/dot/57267
“Lake 90 Variable Speed Limit Corridor” May 2021. [Online]. Available: https://urgentcomm.com/operations/georgia-turns-to-carbyne-toenhance-location-information-for-statewide-transportation-system.
Laval, J. A., Guin, A., Chilukuri, B., and Cho, H. W. “Travel-time Optimization on I-285 with Improved Variable Speed Limit Algorithms and Coordination with Ramp Metering Operations.” Feb. 2019. [Online]. Available: https://g92018.eosintl.net/eLibSQL14_G92018_Documents/14-14.pdf.
Cho, H., Robartes, E., and Fontaine, M. “Operational and Safety Effects of the I–95 Variable Speed Limit System in Fredericksburg, Virginia.” Jan. 2025. [Online]. Available: Carrick, G. and Burgess, L. “Unmanned Aircraft Systems for Traffic Incident Management” Feb. 2022. [Online]. Available: https://ops.fhwa.dot.gov/publications/fhwahop20063/fhwahop20063.pdf.
Larson, K. “Dust Detection and Warning System Tracks Its First Season.” Nov. 2020. [Online]. Available: https://azdot.gov/adot-blog/dustdetection-and-warning-system-tracks-its-first-season.


