2025 Executive Briefing
BRIEFING HIGHLIGHTS

- New data sources are enabling greater situational awareness for roadway networks not possible under prior generations of traditional infrastructure-based data collection.
- North Carolina Department of Transportation’s (DOT) Integrated Corridor Management (ICM) project connecting the state’s two largest TMCs is estimated to have an overall Benefit-Cost Ratio of 2.95.
- Pennsylvania DOT implemented virtual queue protection corridors to alert motorists of upcoming queueing, reducing crashes by 11 percent.
Introduction
Traffic Management Systems (TMS) comprise a complex, integrated blend of hardware, software, processes, and people performing a range of functions, actions and services focused on improving the surface transportation network’s travel efficiency, safety, and predictability [1]. A Traffic Management Center (TMC) operates as the hub or nerve center of a TMS and is where most traffic management activities such as data collection, command and control of ITS devices, incident response, and dissemination of traveler information are coordinated.
New technologies, data sources, and advances in telecommunications have enabled the emergence of new capabilities and possibilities with Next-Generation or “NextGen” TMSs. These systems offer the potential to transform how agencies actively manage and operate the surface transportation system while improving the safety, mobility, and reliability for all travelers. Active Traffic Management (ATM), which uses real-time data and dynamic control strategies (e.g., variable speed limits, lane control, and hard shoulder running), and Integrated Corridor Management (ICM), which coordinates freeway, arterial, and transit systems to optimize corridor performance, have become increasingly popular approaches for managing multimodal corridors more efficiently and proactively [2].
NextGen TMCs and TMSs are ultimately expected to [3]:
- Actively manage and control traffic, including the use of integrated predictive analytics tools and methods.
- Share and utilize emerging data sources, including connected vehicle data and third-party and service provider data. Through Artificial Intelligence (AI) and data analytics, these data can be leveraged to enhance operational decision-making.
- Expand surveillance and coverage for improved situational awareness.
- Provide modular and expandable platforms, making it easier for agencies to manage, maintain, and modify to meet their evolving needs.
Benefits
Capacity and Demand Management. TMSs play a crucial role in managing traffic flow by balancing capacity and demand. This is done by monitoring traffic conditions, analyzing data, and implementing strategies to optimize traffic movement. ATM entails strategies that dynamically manage recurrent and non-recurrent congestion based on prevailing and predicted traffic conditions. There are various ATM strategies, such as dynamic lane use, dynamic shoulder use, variable speed limits, and adaptive ramp metering, that enhance throughput and reliability. For example, an ATM deployment in Minneapolis that included Intelligent Lane Control Signals (ILCS) demonstrated an estimated 8 to 22 percent increase in throughput and a 9 to 23 percent decrease in collisions after implementation (2021-B01582). While ATM focuses on actively managing traffic flow along a specific corridor or facility, ICM adopts a broader, multimodal approach by coordinating freeway, arterial, and transit operations to optimize performance across the entire corridor. To better manage network demand, North Carolina DOT is deploying an ICM project along the I-85/I-40 Route. The system, which is expected to support future CAV technology for vehicle control, traffic optimization and platooning technologies, is estimated to provide $36.2 million in travel time reliability savings and have an overall Benefit-Cost Ratio of 2.95 (2023-B01754).
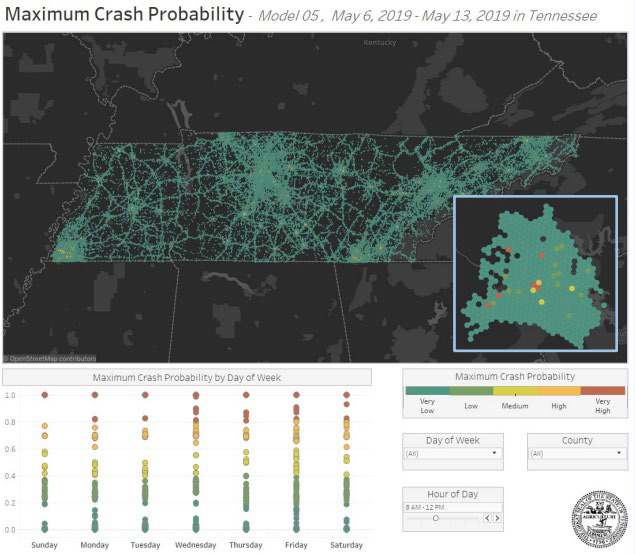
Incident Management/Public Safety. In addition to managing recurring congestion, agencies use TMSs to manage and respond to non-recurring and unplanned events (such as crashes, road closures, or severe weather). The Tennessee DOT led development of a tool for resource allocation and emergency response planning that utilized a prediction model to generate crash forecasts. Known as the Crash Reduction Analyzing Statistical History (CRASH) tool, the tool helps supervisors develop weekly enforcement plans and allocate personnel to the times and places the model suggests the risks of serious crashes are highest. Key findings have included significant savings in response times, with a 19-percent average improvement when roadside assistance trucks were available (2025-B01977). In an extension of the work, U.S. DOT assessed the value of adding data from a free navigational application to the model, which resulted in higher resolution data and an enhanced visualization interface.
Traveler Information Dissemination. Agencies provide pre-trip information and en-route information to help travelers make better travel decisions and navigate potential disruptions. NextGen TMS often enhance this by offering two-way communication with travelers, providing richer and more responsive traveler information. In recent years, state and local agencies have been looking to new proprietary data sources (including probe and crowd-sourced data). In one example, the Kentucky Transportation Cabinet (KYTC) discontinued its 511 program and partnered with a third-party data provider that uses real-time speed data from data probes to populate real-time traffic information on the state’s website. By phasing out its traditional telephone-based 511 system and shifting all data management to in-house staff, the agency saves approximately $750,000 per year (2020-B01436).
Asset and configuration management. Agencies often maintain an inventory of their ITS assets to understand the asset condition, performance, and resources needed (e.g., maintenance, repair, replacement). To overcome the challenge of disparate asset data and data/process duplication, the Oregon DOT implemented the Features, Attributes, and Conditions – Statewide Transportation Improvement Program (FACS-STIP) Tool. The web-based tool uses spatial mapping functions to provide access to asset management data (location, attributes, and condition) statewide. The FACS-STIP tool was estimated to deliver approximately $3.4 million in tangible benefits, in addition to streamlining data entry and reporting (2021-B01565).

Costs
In addition to TMC facility costs, costs associated with TMS field devices, software, and operational strategies can vary dramatically. As transportation systems become more complex and demands increase, TMCs need to invest in advanced technologies to effectively manage the challenges they face, including upgrading cameras and video equipment to the latest technology. For example, state-of-the-art cameras with 4K resolution provide clearer images, which are crucial for identifying details like license plates or detecting incidents. Additionally, advanced display systems with large screens in operator rooms allow operators to visualize and monitor feeds from multiple sources efficiently. In addition to capital costs, it is critical for agencies to plan for ongoing funding for operations and maintenance (O&M) costs related to staffing, licensing, device maintenance, and server hosting, as such O&M costs often exceed capital costs over the lifecycle of a TMS. Sample costs associated with NextGen TMS and TMCs are summarized in Table 1.
Table 1: Sample Costs Associated with NextGen TMS and TMCs
| System | Cost | Location |
|---|---|---|
| TMC Video Wall | Purchase and installation of 40 assembled 55-inch Liquid-Crystal Display (LCD) video monitors for the TMC Control Room was estimated at $1.5 million (2025-SC00571). | Dallas, Texas |
| Advanced Traffic Management System (ATMS) Upgrade | Software and ITS hardware to support an ATMS upgrade was estimated to cost $5 million. The upgrade included automated Traffic Signal Performance Measures, extended signal integration, establishing citywide traffic modeling capacity, semi-automated signal operations, analytics-based continuous traffic counts, CAV support, enhanced citywide event management coordination and route guidance, curb and parking management and integration, ICM, central system transit signal priority and emergency vehicle preemption, and evacuation program creation (2025-SC00573). | Chicago, Illinois |
| ICM Strategies | Capital, Operating, and Maintenance Costs for ICM Strategies including incident detection system, expanded freeway service patrol, ramp metering system, variable speed limits and queue warnings, and signal coordination was estimated to range from $4.9 to $5.1 Million (2022-SC00510). | Buffalo, New York |
| Fiber-optic Trunkline | Deployment of a fiber-optic trunk line connection between two TMCs along I-85/I-40 was estimated at $9.47 million (2023-SC00533). | North Carolina |
| Industrial Internet-of-Things (IIoT) Asset Monitoring System | A pilot system instrumented two retaining walls, two sign structures, and four crash barriers with sensors to view device health and configure device settings for an estimated cost of $100,000 (2022-SC00506). | St. Louis, Missouri |
Best Practices
In transitioning from current TMS to a NextGen TMS, agencies may consider a variety of topics, including systems and technologies, staffing and organization, business processes, collaboration with other departments and agencies, and TMS performance measurement.
Agencies should consider the following practices when transitioning to NextGen TMS:
Maintain performance dashboards to increase public awareness of TMS performance and to increase accountability to stakeholders. NextGen TMS dashboards that enable real-time data ingestion from multiple sources and continuous auto-refresh can be utilized at the operator level to support decision-making. For example, Iowa DOT integrated telematics from snowplow trucks into real-time dashboards that overlaid snowplow trajectories on a heat map to show snow removal activities with respect to traffic speeds. This dashboard allowed TMC operation managers to analyze storm impact and deploy truck, ensuring that resources (e.g., salt) were effectively allocated (2022-L01105). Additionally, the Virginia DOT maintains a Transportation Performance Program Dashboard that provides system performance metrics to the public and agency leadership, promoting transparency and data-driven management (see Figure 2).
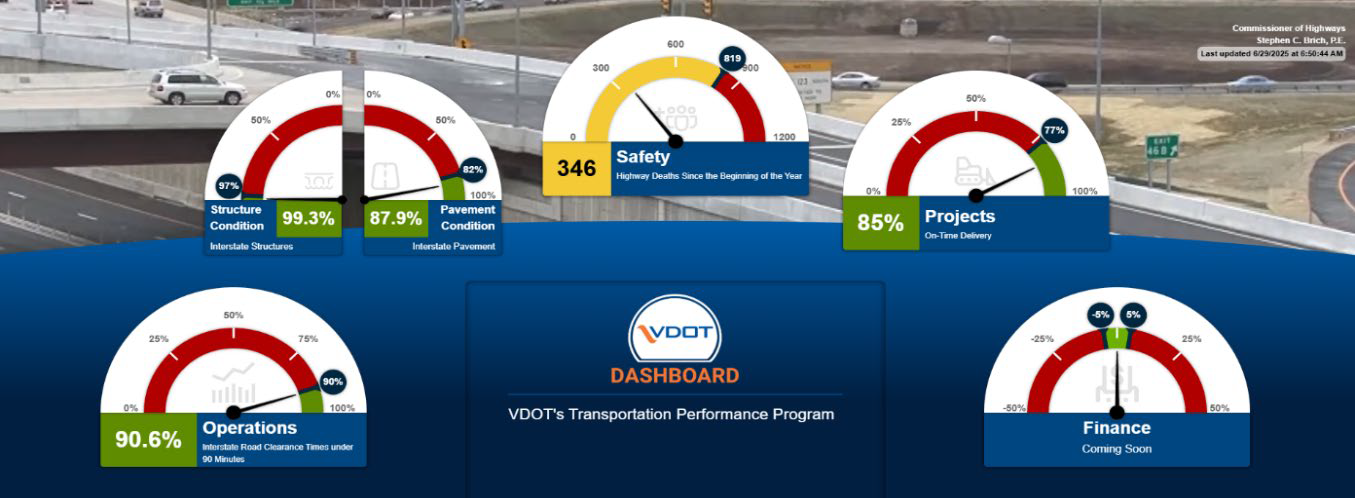
Figure 2: Virginia DOT Transportation Performance Program Dashboard (Source: Virginia DOT). - Evaluate the long-term computing architecture needed for NextGen TMS systems for cost-effective and scalable performance. As part of the Advanced Transportation and Congestion Management Technologies Deployment (ATCMTD) Grant Program, Delaware DOT implemented and evaluated an Artificial Intelligence-enhanced Integrated Transportation Management System (AI-ITMS) to improve the overall monitoring of their TMC. Future system scalability necessitates assessing the balance between on-premises and cloud-enabled capabilities. Agencies must consider Artificial Intelligence and Machine Learning (AI/ML), modeling, and simulation data storage and computing needs, including the costs of Graphical Processing Units (GPUs) needed to accelerate the computations, to guide cost-effective infrastructure choices (2025-L01250).
- Develop Advanced Traffic Management Systems Software that is configurable. Under traditional TMS, operational strategies may be “hard coded” or difficult to configure or change. Under NextGen TMS, agencies address system weaknesses through software configuration, without the need for replacement of subsystems. Using configurable modules for components such as controller parameters, detection zones, CCTV presets, etc. will expand applications, lower support costs, and enhance travel experience while addressing fast-changing conditions with automation (2024-L01231).
- Integrate an interoperable Traffic Incident Management (TIM) platform into a TMC for enhanced inter-agency coordination. TIM managers interviewed in a recent study indicated that the benefits of integrating their respective interoperable communications platforms (such as TMC systems and law enforcement Computer Aided Dispatch (CAD)) outweighed the costs in terms of improving incident response and enhancing interagency coordination. They also recommended that the interoperable communication platforms be treated as secondary support systems (2025-L01253).
Success Story
Virtual Queue Protection Corridors – Pennsylvania DOT
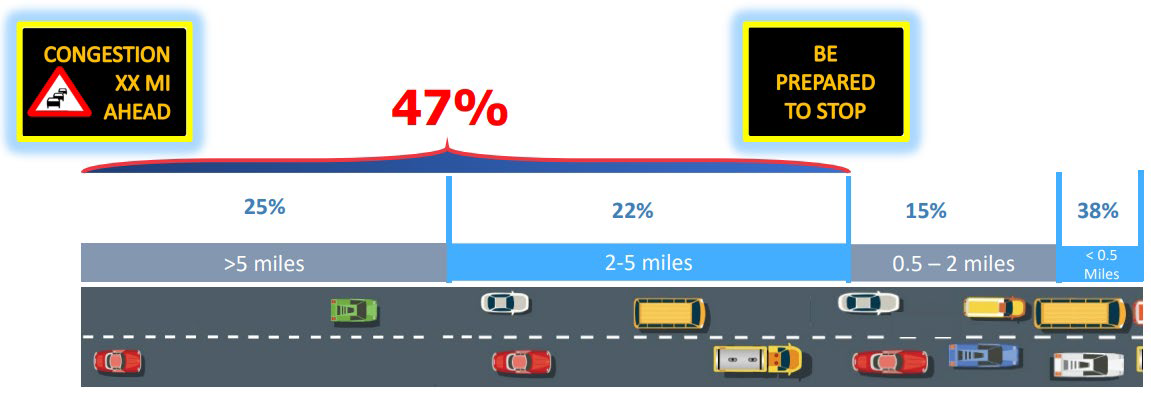
Congested travel conditions on freeway facilities present significant safety concerns—particularly with their increased potential for rear-end collisions. Such conditions typically result in unexpected shock waves of unstable traffic flow propagating upstream of incidents, bottlenecks, or other restrictions. This was particularly a problem for Pennsylvania DOT (PennDOT), where the agency was seeing roughly 7,000 crashes occur in pre-existing congestion annually [4]. Further, nearly half of the crashes in work zone congestion were occurring two or more miles back from the beginning of the work zone (as depicted in Figure 3). A solution was needed that 1) allowed motorists to be warned of an impending queue, without relying on traffic management center operators for detection and constant updates of the message signs; and 2) did not rely on the deployment of costly isolated physical detectors.
In 2021, PennDOT integrated a virtual queue detection module into their ATMS for over 10 corridors. The module uses vehicle probe speed data to detect slowdowns along specific sections of a corridor. Additionally, “geofences” built within the module link existing message boards within the vicinity of each geofence to provide alerts to motorists about upcoming queueing. When speeds drop below 30 miles per hour (mph), the built-in algorithm will automatically display predetermined messages to each message board based on calculated slowdown times, giving travelers a chance to slow down before they get to the traffic. The messages extend to variable speed limits, winter weather, and notice of white out conditions within a 15-mile geofence [5].
| PennDOT’s Virtual Queue Protection Corridors project was named the Overall Winner of NOCoE’s 2024 TSMO Awards [6]. |
Before and after analysis of the implementation of the virtual queue protection corridors found the following benefits [5]:
- Significant Crash Reduction. Total crashes were reduced 11 percent from 1,808 crashes per year (prior to activation) to 1,625 (-183 Crashes). Additionally, one third of the corridors’ fatal and injury crashes decreased by over 20 percent.
- Travel Time Savings. Drivers in these corridors recouped an estimated 72,116 vehicle hours in one year, post-activation.
- Monetized Benefits: The system saved PennDOT over $3 million in project costs.
- Protection: The system protected over 4,500 short-term work zones and avoided almost 3,000 incidents.
PennDOT now uses the solution in nearly 20 locations covering 600 miles of key roads in Pennsylvania. As a testament to the project’s effectiveness and impact, the National Operations Center of Excellence (NOCoE) named PennDOT’s innovative Virtual Queue Protection Corridor project the overall winner of their 2024 Transportation Systems Management and Operations (TSMO) Awards [6]. With the success of the project, PennDOT intends to roll it out to more locations across the state and is studying areas where it might be most useful. PennDOT is also working to increase the number of portable message signs that can be brought into the system, e.g., to provide protection for temporary situations, like work zones.
References
FHWA, “Managing Traffic Management Systems Assets,” 2024. https://highways.dot.gov/sites/fhwa.dot.gov/files/FHWA-HRT-24-088.pdf
FHWA, "Mainstreaming Integrated Corridor Management: An Executive Level Primer," 2019. [Online]. Available: https://ops.fhwa.dot.gov/publications/fhwahop19040/fhwahop19040.pdf.
FHWA, “Next Generation of Traffic Management Systems and Centers: A Primer,” 2024. https://highways.dot.gov/media/49321
NOCoE, “Virtual Queue Protection Corridors – Case Study,” 2024. https://transportationops.org/system/files/uploaded_files/2024-11/Pennsylvania%20DOT%20-%20Virtual%20Queue%20Protection%20Corridors%20-%20NOCoE%20Case%20Study.pdf
TMC Pooled Fund Study, Webinar on “Using Geofencing to Actively Monitor, Collect and Share Information, 2024. https://tmcpfs.ops.fhwa.dot.gov/projects/sharingtmsinfo.htm
NOCoE, “2024 TSMO Awards,” 2024. https://transportationops.org/tsmoaward/2024


