2025 Executive Briefing
BRIEFING HIGHLIGHTS
- ITS technologies such as unmanned aerial vehicle (UAV) based bridge inspections, mobile curbside mapping, radio frequency identification (RFID) based sign tracking, and automated traffic signal performance diagnostics can support AM.
- While leveraging emerging technologies for AM often require upfront investments in hardware, software, data storage, and system integration, these technologies typically generate long-term savings by lowering labor costs, avoiding expensive emergency repairs, and extending the useful life of assets.
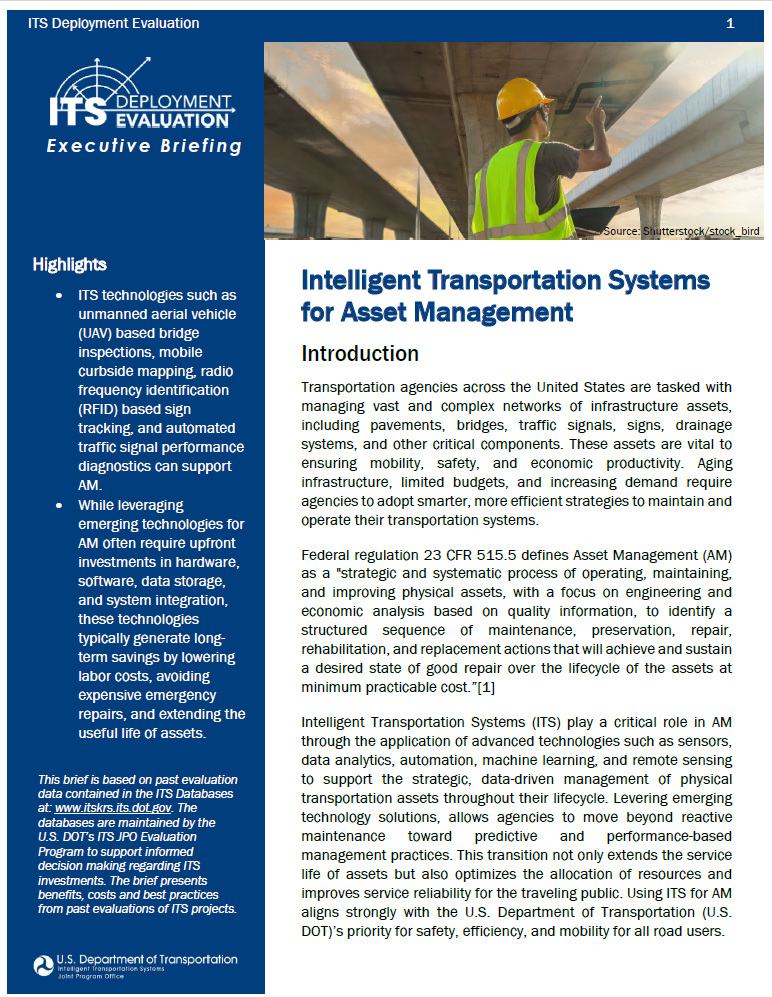
Introduction
Transportation agencies across the United States are tasked with managing vast and complex networks of infrastructure assets, including pavements, bridges, traffic signals, signs, drainage systems, and other critical components. These assets are vital to ensuring mobility, safety, and economic productivity. Aging infrastructure, limited budgets, and increasing demand require agencies to adopt smarter, more efficient strategies to maintain and operate their transportation systems.
Federal regulation 23 CFR 515.5 defines Asset Management (AM) as a "strategic and systematic process of operating, maintaining, and improving physical assets, with a focus on engineering and economic analysis based on quality information, to identify a structured sequence of maintenance, preservation, repair, rehabilitation, and replacement actions that will achieve and sustain a desired state of good repair over the lifecycle of the assets at minimum practicable cost.”[1]
Intelligent Transportation Systems (ITS) play a critical role in AM through the application of advanced technologies such as sensors, data analytics, automation, machine learning, and remote sensing to support the strategic, data-driven management of physical transportation assets throughout their lifecycle. Levering emerging technology solutions, allows agencies to move beyond reactive maintenance toward predictive and performance-based management practices. This transition not only extends the service life of assets but also optimizes the allocation of resources and improves service reliability for the traveling public. Using ITS for AM aligns strongly with the U.S. Department of Transportation (U.S. DOT)’s priority for safety, efficiency, and mobility for all road users.
This Executive Briefing presents examples of how ITS technologies have been deployed to support AM, detailing their benefits, costs, best practices, and lessons learned within the ITS Deployment Evaluation website [2]. The briefing draws from real-world deployments, including innovations like UAV-based bridge inspections, mobile curbside mapping in Los Angeles, RFID-based sign tracking, and automated traffic signal performance measures.
Benefits
Technologies are transforming the way transportation agencies manage their physical assets, delivering measurable benefits in efficiency, safety, cost-effectiveness, and operational reliability. Agencies that have adopted ITS solutions for asset management reported improvements in data collection accuracy, infrastructure inspection and decision-making through more streamlined and efficient systems.
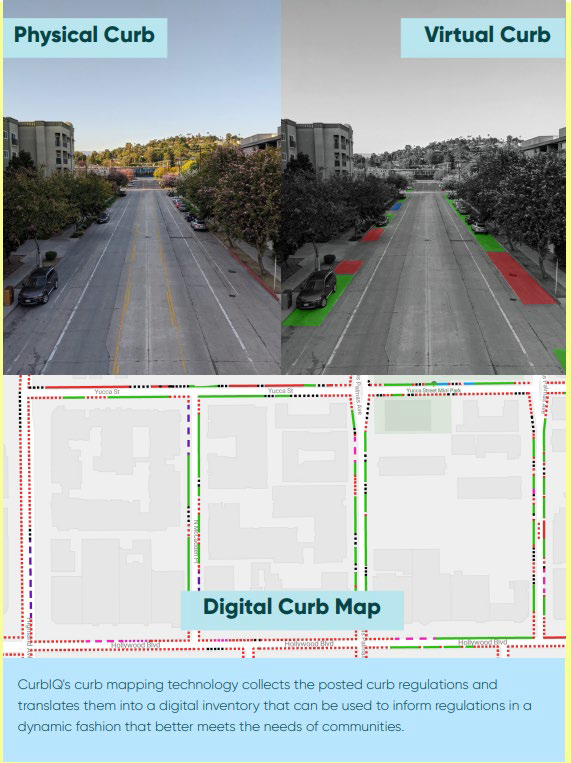
Curbside Asset Management: Effective curbside management requires accurate, up-to-date inventories of curb assets such as signage, markings, parking meters, and loading zones. Traditional data collection methods, typically involving manual, pedestrian-based surveys are labor-intensive, time-consuming, and prone to inconsistency, especially in large or complex urban environments. These limitations create barriers to maintaining current curb data, which is critical for supporting dynamic curb uses, policy enforcement, and multimodal planning. To address these challenges, some transportation agencies have begun exploring technology-driven alternatives to traditional survey methods. For example, the Los Angeles Department of Transportation (LADOT) piloted an augmented mobile mapping system as part of its “Digitizing the Curb” initiative. This technology integrates machine vision and geospatial data to automate curbside asset inventories. The results show that data collection using the mobile mapping approach was between four to eight times faster than traditional pedestrian-based surveys. The system achieved an over 90% percent detection rate for signage type and content, demonstrating both accuracy and speed in asset data collection (2024-B01871).
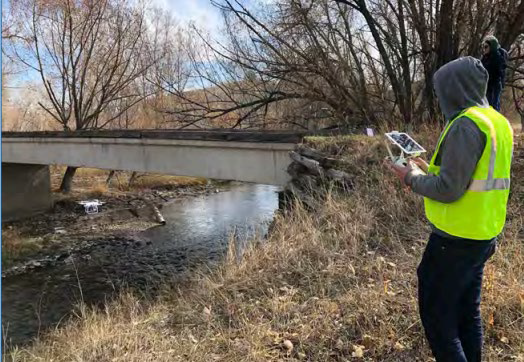
Bridge Asset Management: Traditional bridge inspection and monitoring methods are time-consuming, labor-intensive, and often place personnel in hazardous environments. These conventional approaches can also delay the availability of critical structural information, especially following extreme events such as earthquakes. Faster, safer, and more responsive infrastructure inspection and monitoring solutions are needed to improve the resilience and management of bridge assets. To address these challenges, some transportation agencies are leveraging advanced technologies such as UAVs, machine learning, and digital twins. The Colorado DOT deployed an automated system utilizing UAVs paired with computer vision and machine learning. This approach reduced on-site inspection times from two weeks to just two hours for some bridges. The UAV-based system not only expedited the inspection process but also improved safety by reducing the need for inspectors to access hard-to-reach or hazardous locations manually (2022-B01682). Further advancing bridge asset management, the Bridge Rapid Assessment Center for Extreme Events (BRACE2) was developed to provide real-time structural health monitoring, especially following seismic events. The system leverages digital twin technology to simulate and assess the performance of bridges during earthquakes. In one instance, BRACE2 monitored 279 strong motion events, including 62 recorded events for the Hayward Bridge in California, providing timely and critical information for decision-makers during emergencies (2025-B01974).
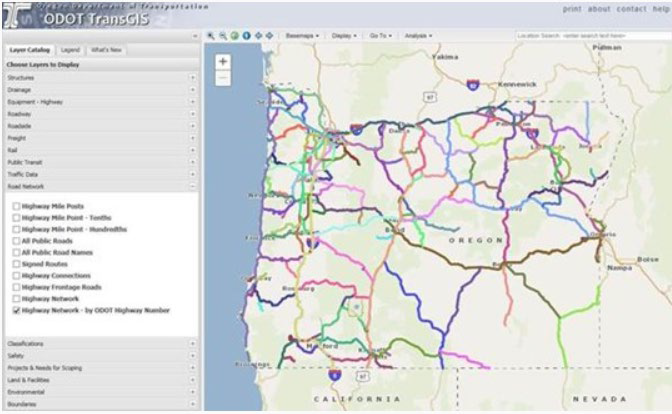
Infrastructure Asset Data Management: State Departments of Transportation (DOTs) often face challenges in efficiently managing vast amounts of infrastructure asset data. Traditional asset management processes frequently rely on disconnected systems, manual data entry, and time-intensive reporting workflows. These limitations can hinder effective planning, increase labor costs, and reduce the timeliness and accuracy of data used for decision-making. To overcome these inefficiencies, some DOTs have adopted integrated digital platforms to streamline asset management processes. Oregon DOT’s TransInfo and FACS-STIP (Features, Attributes and Conditions Survey – Statewide Transportation Improvement Program) systems demonstrated benefits for statewide asset management. These tools utilize Geographic Information Systems (GIS) and web-based reporting to streamline the collection, visualization, and analysis of asset data. The TransInfo unifies disparate asset data, maintains spatial accuracy, and supports inventory, maintenance, and reporting needs. The FACS-STIP Tool complements this by providing web-based access to asset location, condition, and attributes via interactive maps and reports. As a result, Oregon DOT is expected to achieve an estimated $3.4 million in tangible savings. It was also found to reduce time to enter construction-planning information by 15 percent and labor costs related to data collection, entry, and maintenance by 10 percent. The systems also enabled a 66 percent improvement in overall system efficiency, demonstrating the transformative impact of digitized asset management (2021-B01565).
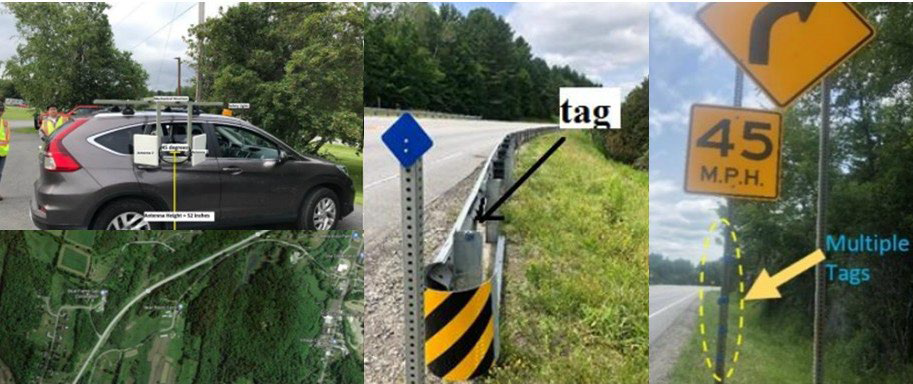
Traffic Signal and Signage Management: Agencies routinely deploy field teams to physically inspect signs. Inspectors record attributes like location, condition, retro reflectivity, and installation date using paper forms or handheld devices. These conventional methods are time-consuming, labor-intensive, and prone to human error, especially for agencies managing large sign inventories across widespread geographic areas. ITS technologies can improve efficiency and reduce the burden of manual inspections. Researchers at the University of Vermont developed a system that uses RFID technology to allow agencies to remotely and automatically track signage assets. During field testing, the RFID-based system achieved a 100 percent scan rate at vehicle speeds of up to 35 mph, significantly reducing the need for labor-intensive manual sign inspections. This efficiency translates into considerable time and cost savings for agencies responsible for large inventories of traffic signs (2025-B01980). Additionally, in the realm of traffic signal management, agencies employing Automated Traffic Signal Performance Measures (ATSPMs) have seen substantial operational gains. ATSPMs continuously monitor signal performance metrics, allowing real-time identification of inefficiencies and failures. For example, Purdue University found that the use of ATSPMs reduced signal diagnostic times, enabling faster response to malfunctions and more efficient signal timing adjustments. This, in turn, reduces vehicle delays and improves overall traffic flow (2025-B01981).
In addition to the above examples, the U.S. DOT is advancing AM though several additional initiatives leveraging emerging technologies. For example, the University of Washington (UW) Transportation Data Exchange Initiative (TDEI) developed under the ITS4US Deployment Program, is modernizing digital infrastructure and governance by developing open-source tools, standards, and interoperability models that enable seamless public–private data exchange. The project focuses on collecting and maintaining rich data on transportation assets – including sidewalks, pedestrian pathways, transit networks, and on-demand services [3]. Also, the U.S. DOT Complete Streets AI (CSAI) initiative is developing AI-powered tools that generate and integrate infrastructure, condition, behavior, and contextual data (for example, the presence and condition of sidewalks and bike facilities) to support planning and deployment of safe, multimodal roadways. By treating data as a core asset, CSAI strengthens AM through inventory visibility, decision-making, and lifecycle oversight for Complete Streets networks [4]. Further, the West Virginia (WV) Structural Health Monitoring (SHM) Project, part of the U.S. DOT's Strengthening Mobility and Revolutionizing Transportation (SMART) grant initiative, installed real-time monitoring sensors on the East Huntington (Gunner Gatski) Bridge in Huntington, WV. The SHM system includes an array of sensors including vibration sensors, tiltmeters, crack meters, displacement sensors, a weather station, and a vessel-collision detection system designed to capture continuous, real-time data on the bridge’s condition. The system enabled researchers to quickly assess that a 3.3 magnitude earthquake did not compromise the bridge’s integrity — information that would normally require more time-consuming inspections [5].
It is important to note that 23 CFR 515.5 defines the core requirements for Asset Management Plans (AMPs) that State Departments of Transportation must prepare and implement for the National Highway System (NHS) and other public roads. Although federal requirements for AMPs focus on pavements and bridges, Federal Highway Administration (FHWA) guidance encourages States to manage other critical assets such as traffic signals, ITS devices, communication equipment and multimodal infrastructure using the systematic risk-based, lifecycle-oriented principles [6]. To fully leverage benefit from ITS technologies, transportation agencies are encouraged to formally include ITS assets within their State AMPs. Incorporating ITS assets into AMPs strengthens investment decision-making, ensures long-term funding visibility, supports consistent maintenance practices, and protects the value of technology deployments.
Costs
The deployment of ITS for AM involves a range of upfront and operational costs that vary depending on the technology, scale of deployment, and complexity of the asset management program. Asset-management programs vary widely across jurisdictions – some are limited to pavements and bridges; others include multimodal networks and ITS/traffic control assets. While ITS solutions often require initial investments in hardware, software, data storage, and system integration, they frequently deliver long-term savings by reducing labor costs, preventing costly emergency repairs, and extending the life of assets. Example costs are shown in Table 1.
Table 1: TAM ITS Technology Cost
| ITS Application | Cost Data |
|---|---|
| Asset Monitoring Systems Using Sensors | A typical sensor-based asset monitoring system designed to monitor seven distinct assets with a total of 65 sensors has an estimated hardware cost of $100,000. This cost includes the deployment of data acquisition units, power supply systems (often solar), communication infrastructure, and backend servers to process and visualize asset condition data. These systems are scalable depending on the number of assets and the complexity of the monitored infrastructure (2022-SC00506). |
| Unmanned Aerial Vehicles (UAVs) for Bridge Inspections | UAVs were deployed to inspect 39 bridges of varying sizes, types, and locations. Equipped with state-of-the-art imaging systems, the UAVs were used to inspect confined spaces in box beams and pier towers, view areas between girders on multi-girder bridges, and examine bearings. An inspection-grade UAV was estimated to cost $15,000–$40,000 to purchase or about $300/day to rent (2020-SC00448). |
| RFID Systems for Traffic Signage Management | Deploying an RFID-based signage management system involves relatively modest costs. The estimated hardware cost for a passive RFID tag and reader system is approximately $4,860 per 1,000 signs. This includes the cost of durable RFID tags affixed to the signage and handheld or vehicle-mounted readers. While the upfront equipment costs are minimal, the return on investment comes from reduced manual inspection labor and improved asset tracking accuracy (2021-SC00494). |
| Web-Based Structural Health Monitoring (BRACE2) | The BRACE2 digital twin platform for post-disaster bridge assessment demonstrates the low-cost nature of cloud based ITS solutions. Operating the platform incurs a nominal cost of less than $20 per month, which covers data storage, processing, and basic computational resources. Given the critical nature of bridge health monitoring – especially after seismic events – this represents a cost-effective solution for agencies managing earthquake-prone infrastructure (2025-SC00572). |
Lessons Learned
The successful deployment of ITS for AM requires more than just technology investment – it also demands thoughtful planning, effective processes, robust data governance, and stakeholder coordination. Some lessons from recent deployments are highlighted below:
- Prioritize Data Quality and Accuracy: High-quality data is the foundation of effective asset management. Deployments using technologies like augmented mobile mapping and UAV-based inspections emphasize that capturing detailed, accurate data is critical for informed decision-making (2024-L01233). Agencies must ensure the following:
- Use of high-frequency imaging and sensor readings to prevent missed or blurry data (e.g., avoiding blurred curb signs in mobile mapping projects)
- Implementation of quality control processes during both data collection and post-processing stages; and
- Routine validation of data accuracy, especially when integrating automated systems with human-reviewed datasets.
- Implement Hybrid Data Collection Approaches: A key lesson from the LADOT augmented mobile mapping deployment is that while automation greatly increases efficiency, it is most effective when complemented by targeted manual efforts. For example, a 90 percent automated to 10 percent manual survey blend was recommended for complex urban environments where machine vision struggles with occlusions, poor Global Positioning System (GPS) accuracy (urban canyon effects), or ambiguous signage. Combining machine-driven data collection with human verification ensures comprehensive and accurate asset inventory (2024-L01233).
- Optimize Operational Workflows: For mobile mapping and asset data collection, designing driving routes that minimize redundancy and maximize coverage. Additionally, develop efficient field protocols, such as “drive each street only once” strategies, to avoid unnecessary data duplication and labor costs and integrate automation into asset management platforms to reduce the burden on field personnel (2024-L01233).
- Institutionalize Performance-Based Management: Agencies that have adopted ATSPMs demonstrate how real-time performance monitoring can be institutionalized to drive operational improvements. Best practices include embedding performance measures into day-to-day operations, capital planning, and maintenance workflows, aligning performance targets with agency-level goals (e.g., safety, mobility, cost efficiency) and utilizing dashboards and automated alerts to facilitate proactive maintenance rather than reactive repairs (2023-L01203).
- Right-Size Technology to the Use Case: Deployments of RFID-based sign management systems underscore the importance of selecting technologies that align with operational realities. For example, understand technical limitations such as scan range, line-of-sight requirements, and vehicle speed constraints and adjust deployment strategies accordingly. Also, avoid overdesigning systems beyond what is practically needed for the asset type or network size (2021-L01050).
- Leverage Existing Data Where Possible: The BRACE2 platform demonstrated how leveraging existing structural health monitoring sensor data and integrating it with real-time analytics reduces the need for extensive new installations. Agencies should conduct an inventory of current sensor deployments and data sources and prioritize enhancing existing data streams with ITS capabilities (e.g., adding predictive analytics) before deploying entirely new systems (2025-L01255).
Case Study – LADOT Digitizing the Curb Initiative
| LADOT’s Digitizing the Curb initiative uses vehicle-mounted cameras, machine vision, and GIS to efficiently collect and map curbside asset and regulation data across neighborhoods. |
As urban environments become more complex, managing curbside assets such as parking zones, signage, bike racks, loading areas, and fire hydrants has become increasingly important for cities seeking to optimize curb usage for various needs like ridesharing, deliveries, transit, micro-mobility, and emergency services. Traditionally, curb asset inventories rely on manual, pedestrian-based surveys that are labor-intensive, time-consuming, and prone to inconsistencies. To address this challenge, the LADOT and partners piloted an Augmented Mobile Mapping System as part of their “Digitizing the Curb” initiative. This project aimed to develop a scalable and efficient approach for collecting curb regulation data across multiple neighborhoods (2024-B01871). The mobile mapping system integrates:
- Vehicle-mounted cameras capturing high-resolution, georeferenced street-level imagery
- Machine vision algorithms trained to detect and classify curbside assets, signage, and painted curb markings
- Curb Converter software, which processes image data and transforms it into structured curb regulation information compatible with GIS.
- GPS and GIS tools to ensure location accuracy and data mapping; and
- A cloud-based backend for data storage, visualization, and export to curb management platforms.
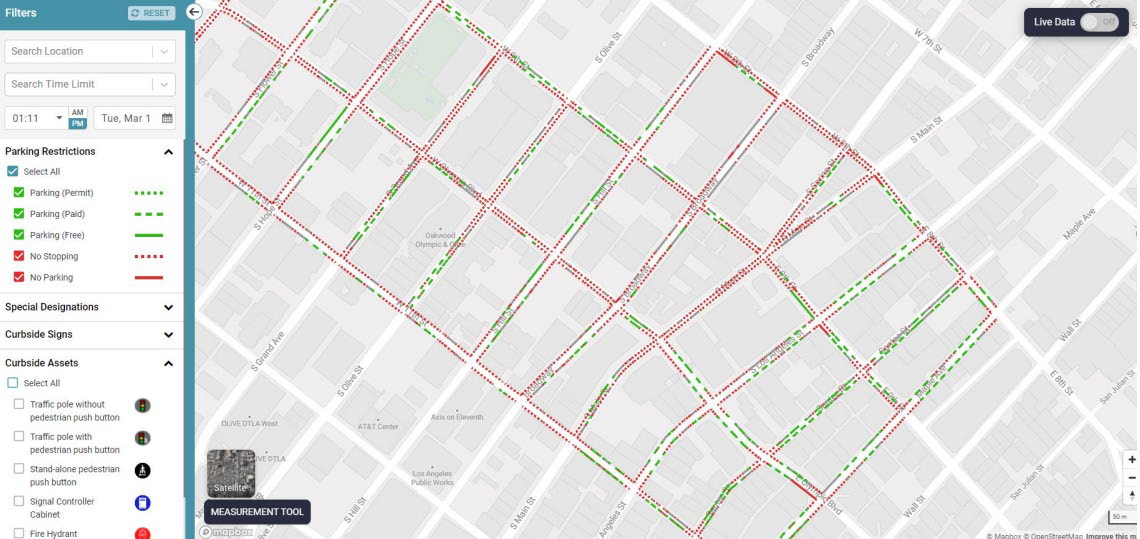
This solution was compared against a manual survey method that used a curb wheel, a pedestrian-based tool that combines distance wheel measurements with mobile app-based data entry. Figure 5 is a screenshot of the curbside inventory tool dashboard, which displays various parking restrictions along streets. The green lines indicate locations where parking is permitted (either paid or free), while the red lines indicate areas where parking or standing is prohibited.
The following were observed:
- The mobile mapping approach achieved four to eight times faster data collection compared to pedestrian-based surveys in low- to medium-density areas.
- Sign detection rates ranged from 93 percent to 98 percent, with most signage located within three to 10 yards of their actual mapped location.
- For high-density urban centers, particularly areas with tall buildings (urban canyons), GPS signal degradation impacted accuracy, requiring manual intervention to validate or correct datasets.
- The machine vision model continued to improve with iterative training, suggesting that detection rates could increase over time with more data inputs
- GPS Signal Interference was observed. Tall buildings caused signal reflection and dropouts, affecting geolocation accuracy.
- Parked vehicles, trees, and other street furniture occasionally obstructed signs from the camera’s view.
- Machine vision struggled to consistently detect curbside paint regulations (e.g., red for no-parking zones) in certain lighting or weather conditions.
- Areas with multiple overlapping curb regulations (e.g., shared bus, delivery, and passenger loading zones) required manual validation.
- High-frequency image capture generated substantial amounts of data, requiring significant cloud storage and robust data management system
This case study demonstrated several key outcomes and impacts resulting from the deployment of the technology including:
- Providing LADOT with a digitized curb inventory that supports dynamic curb management policies.
- Reducing the time and cost needed to update or verify curb regulations citywide.
- Informing LADOT’s broader goals for enhancing multimodal operations, reducing congestion, and improving safety through better curb utilization.
- Setting a precedent for other cities considering scalable curbside data collection and management solutions.
References
“Code of Federal Regulations, Title 23,” National Archives Website. Accessed November 2025. URL: https://www.ecfr.gov/current/title-23/chapter-I/subchapter-F/part-515/section-515.5
“ITS Deployment Evaluation,” U.S. DOT FHWA Website. Accessed July 2025. URL: https://www.itskrs.its.dot.gov
“UW Deployment Overview”, U.S. DOT ITS JPO Website. Accessed September 2025. URL: https://www.its.dot.gov/research-areas/ITS4US/deployments/washington/
“Complete Streets Artificial Intelligence (CSAI) Initiative”, U.S. DOT ITS JPO Website. Accessed September 2025. URL: https://www.its.dot.gov/research-areas/Artificial-Intelligence/Complete-Streets-AI/
“Sensors Deployed on West Virginia Bridge to Monitor Conditions”, Accessed September 2025. URL: https://www.govtech.com/transportation/sensors-deployed-on-west-virginia-bridge-to-monitor-conditions
“Transportation Asset Management Plans” FHWA Website. Accessed November 202. URL: https://www.fhwa.dot.gov/asset/plans.cfm


