ITS for Road Weather Safety
According to the Federal Highway Administration (FHWA), adverse weather is the second largest cause of non-recurrent congestion behind incidents.1 Unexpected severe weather, in particular, is a major cause of harm to the safety and mobility of the transportation system because it often leads to poor visibility, slick pavement, sudden stops and slowdowns, and in some cases multi-car pileups, resulting in serious injuries and/or fatalities.
For example:
- In Louisiana, “superfog” conditions led to a 158-vehicle pileup.
- In Wyoming, a blizzard caused a 70-vehicle pileup on Interstate 80 with many being semi-trucks.
- In Michigan, severe flooding damaged over 300 vehicles and necessitated 50 rescues.
Although the weather cannot be changed, agencies can mitigate its impacts by reporting accurate, real-time weather information to the public, proactively using traffic management solutions to lower the risk of weather-related crashes, and promptly detecting and responding to crashes when they do occur. Intelligent transportation systems (ITS) technologies offer powerful tools that could save lives, reduce travel time, and bring economic benefits. Read more and explore the data visualizations below to better understand the issue of weather-related roadway fatalities and how ITS technologies can be a tool for reducing them.
Weather-Related Roadway Fatality Trends
The National Highway Traffic Safety Administration (NHTSA) Fatality and Injury Reporting System (FARS) provides yearly data on fatalities and injuries suffered in motor vehicle traffic crashes.2 Below, "weather-related roadway fatalities" refer to fatalities in roadway crashes that FARS indicate were under various weather types. These weather types are grouped into four broader categories: high winds & blowing particles, low visibility, rain & flooding, and snow & ice.
Weather-Related Roadway Fatalities by Year and Weather Type Source: Fatality Analysis Reporting System (FARS). Data pulled May 2026. | FARS data indicate that since 2010, weather-related roadway fatalities have increased by about 7 percent, from 3,306 in 2010 to 3,523 in 2024. The weather type associated with these fatal crashes has also changed over time. In the five-year period of 2020 to 2024, the number of rain and flooding fatalities decreased by 10 percent, while the number of low visibility and snow and ice fatalities remained relatively flat. |
FARS data from 2021-2024 show slightly more urban versus rural weather-related roadway fatalities. These weather-related crash fatalities are most frequently associated with rain and flooding conditions. |
Urban-Rural Divide in Weather-Related Roadway Fatalities, 2021-2024 Source: Fatality Analysis Reporting System (FARS). Data pulled May 2026. |
Multi-Car Pileups
A major concern around adverse weather on our roadways is the threat of multi-vehicle crashes. For purposes of this visualization, multi-vehicle crashes are defined as crashes involving three or more vehicles. Decreased visibility and sudden stopping can lead to situations in which drivers struggle to respond in time to avoid colliding with other vehicles on the road. Adverse weather conditions can lead to longer crash response times, meaning vehicles may stay on the roadway longer in unsafe situations, and injured travelers do not get the prompt medical attention needed during this critical time.
Multi-Vehicle Fatal Roadway Crashes Under Adverse Weather Source: Fatality Analysis Reporting System (FARS). Data pulled May 2026. | FARS data show that the number of fatal multi-car pileups under adverse weather conditions have been relatively stable over the years. However, since 2017 the number of crashes has remained near or above 250 a year. |
The map below shows fatal, multi-vehicle crashes under adverse weather conditions from the years 2021-2024. Each circle represents one crash with the size of the circle representing the number of vehicles involved. The circles are colored by weather type. Filters are available to drill down by year and weather category.
Weather-Related Multi-Vehicle Fatal Roadway Crashes (2021-2024) |

Source: Fatality Analysis Reporting System (FARS). Data pulled May 2026.
ITS Can Help Mitigate the Effects of Extreme Weather Events on Transportation
ITS technologies support real-time situational awareness for transportation agency staff and road users, allowing them to understand and adapt to dangerous road conditions by enabling traveler information, traffic interventions, and post-event management.
Example ITS technologies that can support these capabilities include, but are not limited to, the following (click on each phrase to learn more):
| Vehicle to Everything (V2X) Communications 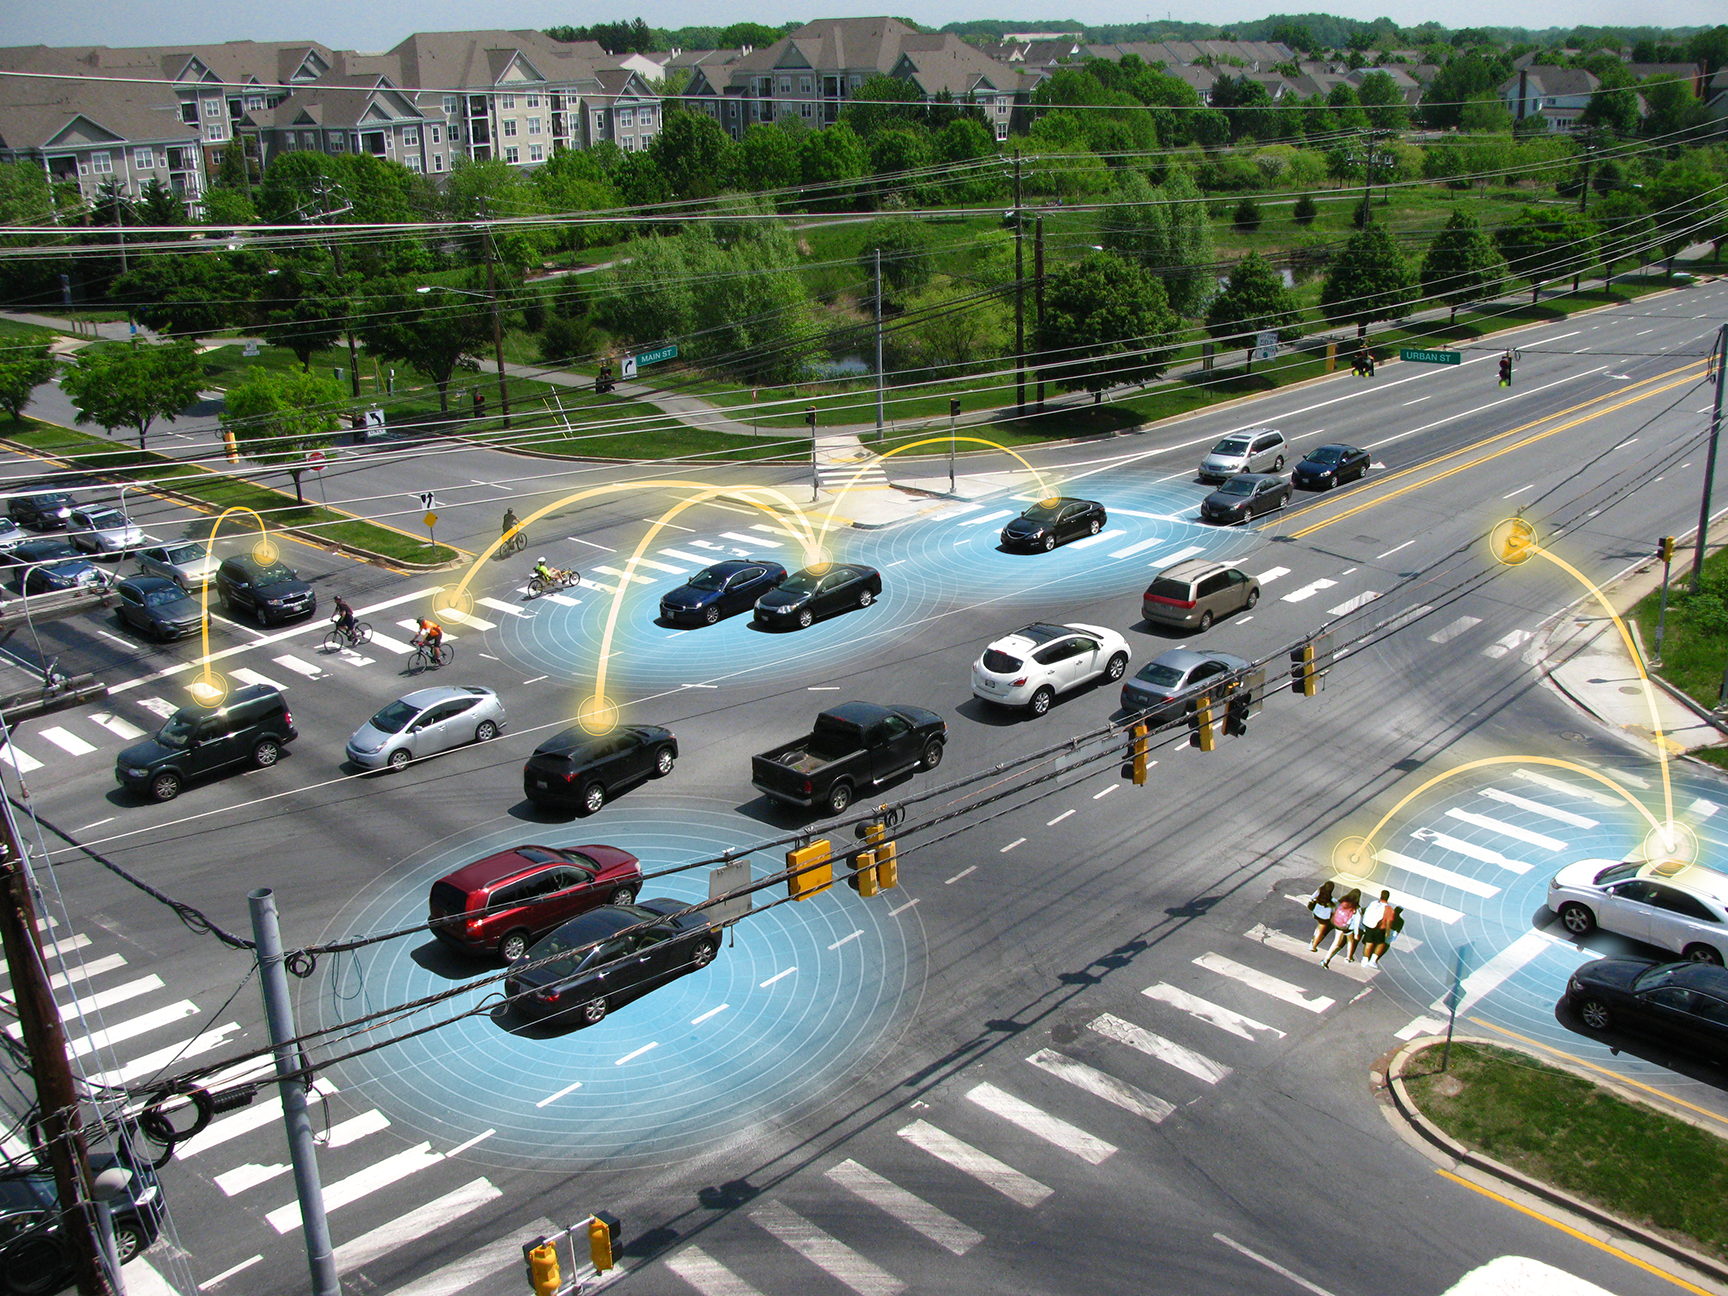
|
| 
|
Agency Adoption of ITS to Improve Safety in Extreme Weather Events
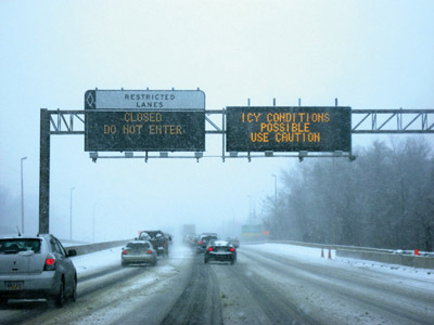
The ITS Deployment Tracking Survey, conducted approximately every three years, measures the deployment of ITS among freeway, arterial, and transit management agencies in a subset of large metropolitan areas. Freeway agencies are largely comprised of State DOT districts, while arterial agencies are primarily local (e.g., city, town, county) agencies. The survey tracks adoption of ITS for a variety of use cases, including collecting data on ITS technologies that could be used to mitigate the effects of extreme weather, such as real time traveler information (RTI), dynamic message signs (DMS), and ESS that helps inform motorists of weather conditions.
Agency Adoption of ITS Technologies to Mitigate the Impacts of Extreme Weather Events | Generally, adoption rates for these technologies were higher among freeway agencies versus arterial agencies. The 2020 ITS Deployment Tracking Survey for freeway agencies found that 98 percent of surveyed freeway agencies in a subset of large metropolitan areas have adopted RTI, 94 percent adopted DMS, and 76 percent adopted ESS. About half of arterial agencies (54 percent) adopted RTI, while 27 percent adopted DMS, and 14 percent adopted ESS. |
Note: Contains DMS as one of the technologies. Source: USDOT ITS JPO Deployment Statistics. | Other RTI adopted by surveyed agencies included 511, social media, email and text/SMS alerts, custom mobile apps, third-party mobile apps, websites, and highway advisory radio. Slightly more than 50 percent of arterial agencies surveyed had adopted RTI, while nearly 100 percent of freeway agencies had. |
Besides these applications mentioned above, other technologies, such as road weather information systems (RWIS), weather-responsive traffic signals, and road weather connected vehicle (CV) applications, are being deployed nationwide. Explore the interactive Map of Selected Road Weather ITS Deployments visualization to see selected deployments of different road weather-related ITS technologies across the United States over the last 10+ years.
State and local agencies around the country have found success implementing extreme weather safety technologies. Below are three examples of agencies successfully adopting extreme weather safety ITS systems and their resulting benefits.
Wyoming DOT's CV Pilot Deployment:
Wyoming DOT, in an effort to reduce the number of adverse weather-related crashes, equipped 320 vehicles—including commercial trucks, highway patrol vehicles, and snowplows—with devices that broadcast weather alerts. The agency observed an improvement in speed limit compliance with an increase in vehicles keeping speeds within +/- 10mph of the limit—from 58.9 percent without alerts to 66.4 percent with alerts—across different weather conditions. You can learn more about this case study in the Benefits, Costs and Lessons Learned Database. | Improved Speed Compliance with CV Alerts in Adverse WeatherSource: WYDOT. |
Michigan DOT's DMS Driver Compliance Study:
Michigan DOT investigated driver compliance with DMS messages to better understand situations where they are most effective. The state calculated odds ratios, which measure the probability of an event (driver compliance) occurring in the exposed group (with DMS) to the non-exposed group (without DMS), to understand how strongly the DMS messages were associated with changes in driver behavior. Drivers who found DMS useful in bad weather were 6.8 to 15.2 times more likely to alter their behavior consistent with the DMS message. You can learn more about this case study in the Benefits, Costs and Lessons Learned Database. | Increased Driver Compliance Due to Inclement Weather MessagesSource: MDOT. |
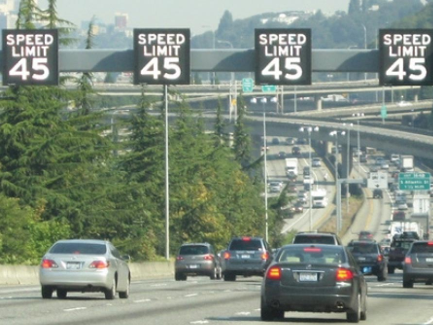
Ohio DOT’s VSL Implementation
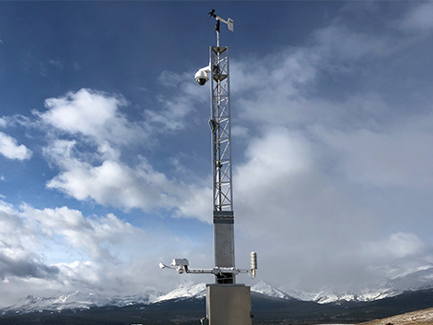
In December 2016, massive snow squalls impacted a major corridor on Interstate 90 near Lake Erie that led to a 50+ car pileup, resulting in a 14-hour closure. With pileups during unexpected lake effect snowstorms becoming far too common, Ohio DOT sought to improve safety along a 12-mile stretch of this corridor. They implemented a Transportation Systems Management and Operations (TSMO) approach using weather sensor stations and cameras to monitor weather conditions.
Data collected from these systems were used to adjust the digital VSL signs placed along the corridor. These signs dynamically change the speed limit to optimize safety under variable conditions. In the two years following VSL implementation, the total number of crashes declined by 21 percent, the number of crashes while snowing declined by 40 percent, and crash clearance times declined by 31 minutes despite there being more snowy days. No fatalities or major pileups occurred in the corridor during the two winters seasons after VSL implementation. You can learn more about this case study in the Benefits, Costs and Lessons Learned Database. | Crash Reductions After VSL Implementation, Especially in SnowSource: ODOT. |
ITS Benefits - Road Weather Safety
Benefits of ITS deployments are recorded and stored in the ITS Benefits database, part of the larger Benefits, Costs, and Lessons Learned databases maintained by the ITS JPO. The ITS Benefits database contains records on the benefits of ITS according to goals identified by the U.S. Department of Transportation, such as safety, mobility, efficiency, productivity, and customer satisfaction.
The following examples are among the many ITS Benefits located in the Benefits section of the Benefits, Costs, and Lessons Learned (BCLL) database.
Traveler Information:
Transportation Management Center (TMC) Interventions:
Post-Incident Management:
In addition to the benefits from the BCLL database, ITS JPO’s ITS and Extreme Weather Events infographics on Snow and Ice and Flooding provide examples of how ITS can help enhance safety and efficiency during extreme weather events.
ITS Costs - Road Weather Safety
There are a broad range of ITS technologies and applications that can be used to enhance extreme weather roadway safety. The figure shows the frequency of unit cost ranges of the ESS and WMS deployed by state DOTs from 2017-2021. | Roadside Detection (RS-D), ESS or WMS Adjusted Capital Cost Histogram (2017-2021) |
| Cost data adjusted to 2020 dollars. |
A few examples of the costs of extreme weather safety systems are highlighted below:
ITS Lessons Learned - Road Weather Safety
ITS Lessons Learned capture the real-life experience of practitioners in their planning, deployment, operation, maintenance, and evaluation of ITS projects. They are a reflection on what was done right, what one would do differently, and how a project could be more effective in the future.
A few examples of ITS Lessons Learned related to extreme weather safety are highlighted below:
The examples highlighted above are among the many ITS Lessons Learned located in the Success Strategies section of the ITS Deployment Evaluation website.
U.S. DOT Extreme Weather Safety Initiatives
With safety as its top priority, U.S. DOT has undertaken a number of efforts to improve road weather safety. These include the Road Weather Management Program (RWMP), and Analysis, Modeling, and Simulation (AMS) tools highlighted below.
Road Weather Management Program The Federal Highway Administration's (FHWA) Road Weather Management Program (RWMP) is dedicated to enhancing the resilience of the U.S. highway system by mitigating the impacts that weather can have on the system. Through collaboration and leadership in the road weather community, and by pioneering the development and application of innovative technologies and strategies, the RWMP aims to improve the management of the transportation system and minimize the impacts of ever-changing adverse road weather conditions.3 |
Implementation of Analysis, Modeling, and Simulation Tools for Road Weather Connected Vehicle Applications Among FHWA's RWMP initiatives, the development of weather-responsive traffic management (WRTM) focuses on actionable strategies for system management and operations. Analysis, Modeling and Simulation (AMS) tools have been used by FHWA and agencies to assess the effectiveness of data sets, strategies, and methods used in WRTM in improving the operational response. Specifically, AMS can be used in both general-purpose commercially available platforms and customized research models tailored for CV systems to assess traffic impacts of extreme weather events. To learn more about AMS tools for road weather CV applications, visit FHWA's report on Implementation of Analysis, Modeling and Simulation Tools for Road Weather Connected Vehicle Applications. For more information on road weather management, please visit: https://ops.fhwa.gov/weather. |
Every Day Counts 
Every Day Counts (EDC) is a State-based model run by the Federal Highway Administration (FHWA) that identifies and rapidly deploys proven, yet underutilized innovations that make our transportation system adaptable, sustainable, and safer for all.4 Every two years, FHWA works with State transportation departments, local governments, tribes, private industry and other stakeholders to identify a new collection of innovations to champion. Round 5 of the EDC Initiative includes Weather-Responsive Management Strategies that promotes the use of road weather data from mobile and CV technologies to support traffic and maintenance management strategies during inclement weather. |
References
U.S. DOT FHWA, "Road Weather Management Overview". Last modified February 2023. https://ops.fhwa.dot.gov/weather/overview.htm
U.S. DOT NHTSA, Fatality Analysis Reporting System (FARS). 2021. https://www.nhtsa.gov/crash-data-systems/fatality-analysis-reporting-system
U.S. DOT FHWA, "About Road Weather Management Program." Last modified January 2024. https://ops.fhwa.dot.gov/weather/about.htm
U.S. DOT FHWA, "About Every Day Counts (EDC)". Last modified June 2023. https://www.fhwa.dot.gov/innovation/everydaycounts/about-edc.cfm