U.S. flag An official website of the United States government Here's how you know
dor gov

The .gov means it's official.
Federal government websites often end in .gov or .mil. Before sharing sensitive information, make sure you're on a federal government site.

SSL

The site is secure.
The https:// ensures that you are connecting to the official website and that any information you provide is encrypted and transmitted securely.

U.S. Department of Transportation Research and Innovative Technology Administration United States Department of Transportation | Office of the Assistant Secretary for Research and Technology
Home
Intelligent Transportation Systems Joint Program Office

Callout Links

  • Benefits
    • About Benefits
    • Browse Benefits
    • Latest Updates
    • Benefits FAQs
  • Costs
    • About Costs
    • Browse Costs
    • Latest Updates
    • Costs FAQs
    • Cost Element Ranges
    • Unadjusted Ranges
    • Adjusted Ranges
    • Indexes
    • Data Sources
  • Deployment Statistics
    • 2020 DTS
    • 1999-2016 Survey Instruments
    • 1999-2016 Deployment Data
    • 1999-2016 Final Reports
    • 1999-2016 Common Survey Questions
    • Special Topic Deployment Surveys
    • User Guide
    • Deployment Statistics FAQs
  • Briefings
  • Lessons Learned
    • About Lessons Learned
    • Browse Lessons
    • Latest Updates
    • Lessons Learned FAQs
  • Decision Support Resources
 

Breadcrumb

  • Home /
  • Decision Support Resources /

Insights from the 2019 CV/AV Survey

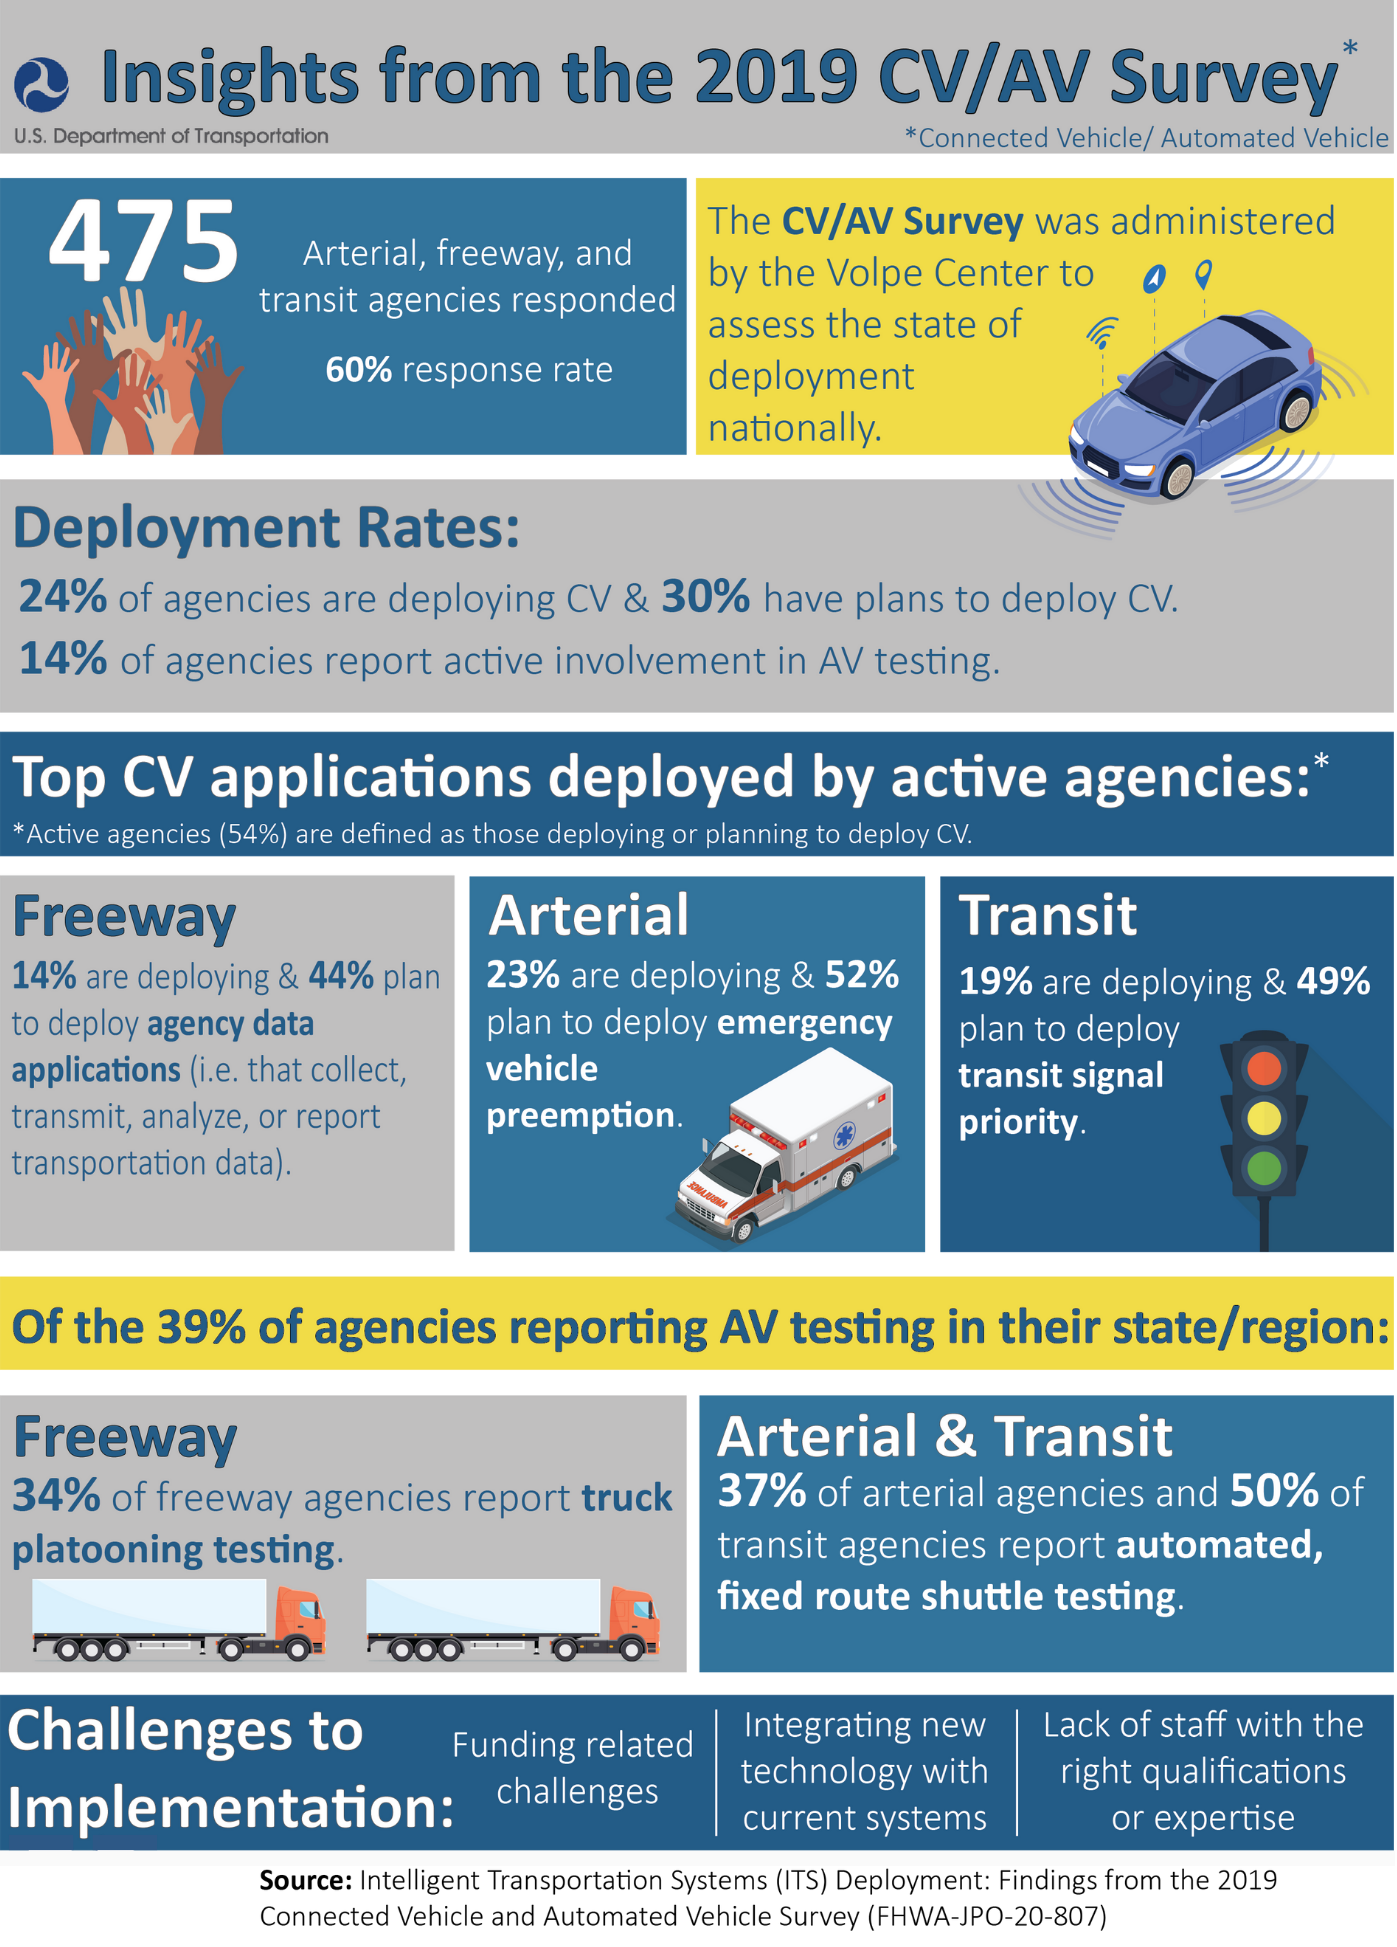
This infographic highlights key findings from the 2019 Connected Vehicle and Automated Vehicle Survey.

Source: Intelligent Transportation Systems Deployment: Findings from the 2019 Connected Vehicle and Automated Vehicle Survey (Final Report, FHWA-JPO-20-807)


Date posted: September, 2021
Last updated: June, 2022

Infographic describing key findings from the 2019 CV/AV Survey.

CLASSIFICATIONS
Download PNG
File type: PNG
Infographic
Vehicle Safety

Related Resources

Insights from the 2020 DTS on System Performance Measures for Arterial Agencies, including that the top safety measures are number of crashes, crash severity, number of fatalities, number of serious injuries, and fatality rate, and the top mobility measures are are travel time, average speed, average delay per vehicle, traffic flow, and travel time reliability.
Insights from the 2020 DTS: System Performance Measures: Arterial Agencies
PNG
06/27/2022
Infographic
Sustainable Travel, Vehicle Safety, Traffic Management
Thumbnail of a map of pedestrian detection technology deployments
Map of Selected Pedestrian Detection Technology Deployments
PNG
06/20/2022
Interactive Visualization
Vehicle Safety
Thumbnail of the pedestrian detection technology deployments
Timeline of Selected Pedestrian Detection Technology Deployments
PNG
06/20/2022
Interactive Visualization
Vehicle Safety
ITS Deployment Evaluation

INTELLIGENT TRANSPORTATION SYSTEMS JOINT PROGRAM OFFICE

1200 New Jersey Avenue, SE
Washington, DC 20590

1-800-853-1351

its.dot.gov

Focus Areas

Benefits

Costs

Deployment Statistics

Briefings

Lessons Learned

ITS Taxonomy

Connect

Database Tutorial

Contact

Topics

Commercial Vehicle Operations

Data Management

Maintenance and Construction

Parking Management

Public Safety

Public Transportation

Support

Sustainable Travel

Traffic Management

Traveler Information

Vehicle Safety

Weather


U.S. Department of Transportation Office of the Assistant Secretary for Research and Technology (OST-R)
 
 
Web Policies and Notices | Accessibility | Careers | FOIA | Privacy Policy | Information Quality | No FEAR Act Data | Ethics
Civil Rights | Office of Inspector General | OIG Hotline | BusinessUSA | USA.gov | White House
 

Copyright © 2022. All rights reserved