This case study discusses "Leveraging Existing Infrastructure and Computer Vision for Pedestrian Detection."
IN THIS CASE STUDY YOU WILL LEARN:
- How some cities are generating new streams of pedestrian data.
- How an agency is leveraging existing infrastructure and computer vision for pedestrian detection.
- How this approach offers a cost-effective, low-risk solution for data collection and analysis for decision makers.
Background
| Using existing traffic camera data and computer vision: 1) enables real-time object detection for different use cases, 2) builds on existing resources, 3) has minimal risks, 4) offers new performance and risk indicators for decision makers, and 5) is easily adaptable to other cities or states. |
Growing attention on pedestrian safety and the benefits of non-motorized travel have led agencies to seek cost-effective methods to collect accurate and timely pedestrian traffic data. Early pedestrian detection programs used manual methods, such as data collection sheets, clickers, or pushbutton-based detection. In recent years, improvements to sensors have enabled the presence and movement of pedestrians to be detected continuously, more accurately, and across a greater geographic area. This has been accomplished with a variety of existing and emerging detection technologies, including Bluetooth and Wi-Fi, infrared sensors, microwave, radar, radio beam, thermal, vision-based, smartphone-based, and LiDAR sensors [1]. Several agencies have tested and deployed these technologies as part of their pedestrian and bike count programs, including for projects that aim to optimize intersection operations, improve vulnerable user safety, or achieve Vision Zero goals [1]. While many of the innovative detection technologies require investment in new devices or infrastructure (e.g., LiDAR or thermal sensors), others can leverage existing resources making them more cost-effective. For example, some cities, including New York City (NYC) [2], Los Angeles [3], and Pittsburgh [4] are taking advantage of their existing closed-circuit television (CCTV) systems to collect new streams of pedestrian data and analyze it with the help of artificial intelligence (AI).
Developing a Data Acquisition and Detection Framework
Leveraging Existing Resources
Many current, commercial, off-the-shelf solutions for pedestrian and vehicle detection require buyers to replace their existing intelligent transportation systems (ITS) infrastructure with new camera devices or sensors, as these solutions typically rely on high-resolution, continuous video feeds to ensure acceptable detection accuracy. The other approach leverages existing ITS infrastructure or equipment, which increases the cost effectiveness of the transportation system and also reduces the chance of its obsolescence. The CCTV system is a valuable source of traffic condition information for many transportation systems. Traffic video data can provide rich information, such as traffic volume, travel speed, curb activities, and incident information, to facilitate traffic operations and management [5]. Traditionally, CCTV systems are predominantly used for vehicle and traffic detection, but they can also be used for pedestrian and micromobility (e.g., bicycles, scooters) detection.
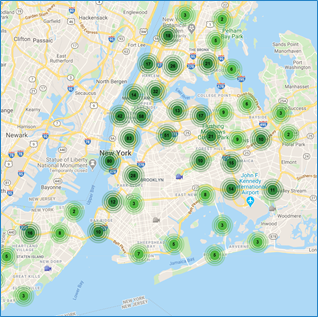
The NYC Department of Transportation’s (NYCDOT) traffic cameras provide frequently-updated still images from 731 locations in the five boroughs (Figure 1). The Traffic Management Center (TMC) often uses these traffic cameras as part of their traffic monitoring and incident response system.
Exploring the Value of Perishable Data
Since CCTV cameras only provide live feeds and do not record any footage, the data from the cameras are considered “perishable.” However, these data can be extracted in an internet of things (IoT) computing environment and mined in real time to gather key information. For example, researchers at C2SMART U.S. Department of Transportation (USDOT) University Transportation Center (UTC) developed a continuous, real-time pedestrian detection framework that uses public traffic camera feeds and deep-learning-based video processing to analyze sidewalk and roadway densities [2]. This framework allows researchers to capture critical data on pedestrian, cyclist, and vehicle densities without any additional infrastructure investment. The following sections discuss the development of this data acquisition and detection framework using real-time traffic camera data collected in NYC and Seattle.
This study focused on quantifying pedestrian density and social distancing (i.e., how often pedestrians maintained the recommended “6 feet” of social distance) during the ongoing COVID-19 pandemic. The C2SMART researchers collected video data for 106 locations in NYC and Seattle, including locations near hospitals, subway stations, areas of high pedestrian and cyclist exposure, and meal distribution centers. This real-time visual recognition process preserves privacy since the video data are low-resolution and the identified objects (e.g., vehicles, bicycles, pedestrians) are untraceable since the public feeds of the video are not continuous [2].
While this study focused on quantifying pedestrian density and social distancing in the pandemic, the overall method of using existing traffic camera feeds and applying computer vision techniques to collect improved pedestrian data could be applied to a number of use cases, such as long-term automated pedestrian and bike count programs, arrival patterns for transit operation optimization, and pedestrian safety applications for connected and automated vehicles (e.g., presence and intention estimation). Access to quicker, more accurate, and more granular pedestrian data allows transportation staff to rapidly respond to changing conditions and make more informed decisions.
Developing the Framework
The C2SMART research team used big data and computer vision, a form of AI, to develop a scalable data acquisition framework [6] to collect large-scale pedestrian data automatically and continuously from sampled streaming footage of active traffic cameras where pedestrian activities are observed (e.g., cameras facing crosswalks or sidewalks). The raw video data are sampled and fed into a deep learning architecture for pedestrian data extraction. The technology can approximate the distance between pedestrians without any facial features or other personally identifiable information. This generalized, reference-free distance approximation method can be scaled up to calculate distances under different conditions (e.g., cameras with different angles) (Figure 2).
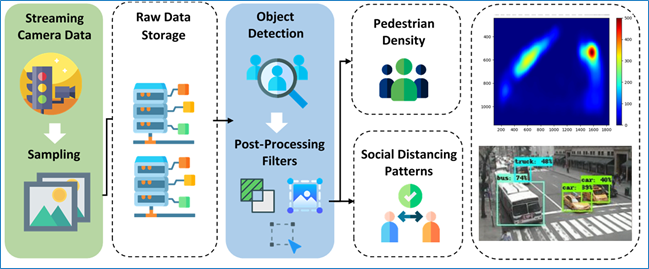
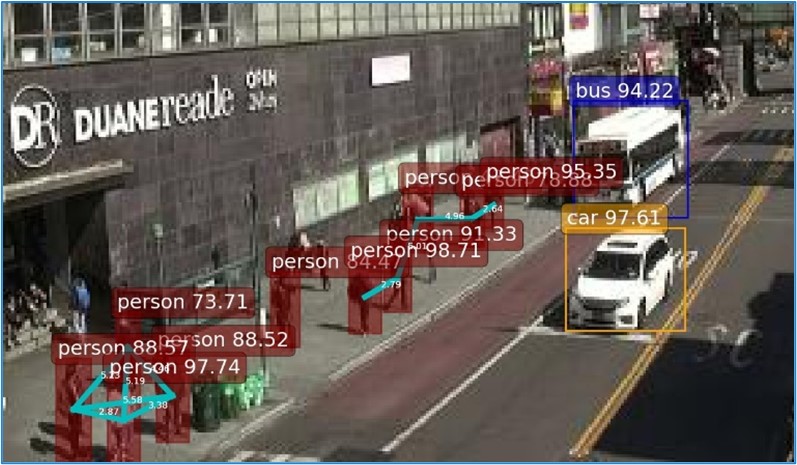
This distance approximation, combined with an open-source pre-trained object detection model and several post-processing filters, demonstrated the feasibility of tracking pedestrian density and physical distancing, which previously had been more difficult metrics to track than others, such as volume and congestion. By continuously tracking areas of high pedestrian density in cities, this system can help reveal potential pedestrian queues and exposure hotspots and provide decision-makers with the data necessary to deploy appropriate countermeasures (Figure 3).
Public health officials, TMC operators, and others can use this technology to monitor pedestrian density and distribution as well as temporal variations in behavior. This information equips them to make more informed decisions. For example, urban planners and engineers can better analyze new pedestrian and mobility patterns.
Expanding This Approach to Other Use Cases
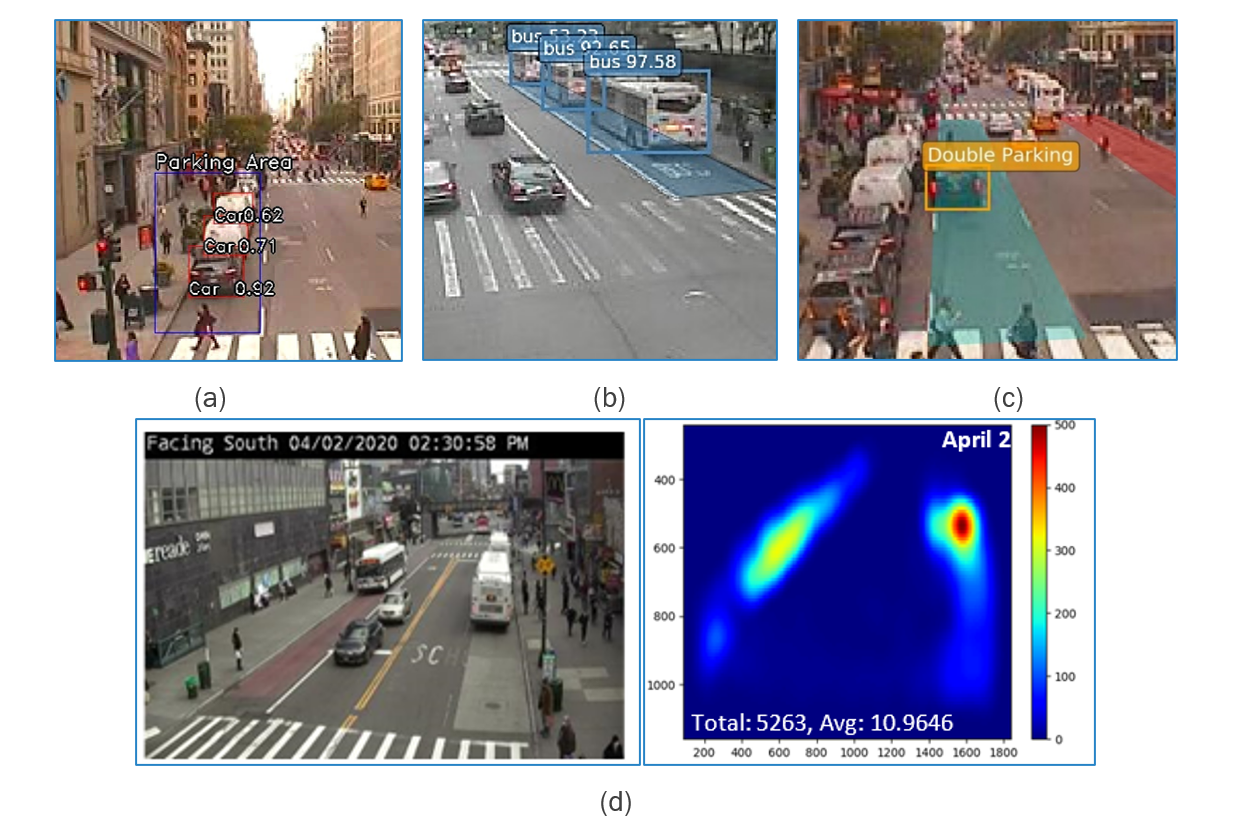
This framework is capable of real-time implementation and can be applied to other pedestrian use cases (e.g., pedestrian safety applications for connected and automated vehicles). It is also highly scalable to help evaluate the impact of other road users, such as buses or parked vehicles. Figure 4 presents four use cases other than social distancing developed by the C2SMART research team, including detection of parking and bus lane occupancy, detection of on-street illegal and double parking, and usage of pedestrian density information at bus stops to assess transit demand. Depending on the use case, this computer-vision approach was empirically tested using several camera feeds in different NYC locations and achieved high detection accuracy (i.e., 86 to 96%).
Providing a Cost-Effective and Safe Solution
Since the project methodology relies on pre-existing deployed ITS infrastructure, implementation and maintenance are low cost and highly scalable. The system deployment cost, based on a 3-year estimate for the proposed pedestrian detection system with 68 cameras, ranges from $500 to $1700 per year [7], depending on the usage of local servers or cloud-based services. The deployment cost only accounts for server acquisition, maintenance and data transfer and storage and does not include costs related to camera operations as they are a part of the existing system. Based on the USDOT ITS Joint Program Office’s 2020 ITS Deployment Tracking Survey (DTS) [8], CCTV is used by 90% of freeway agencies and 60% of arterial agencies in the U.S. Other cities could therefore adapt this methodology to their own traffic camera infrastructure or other traffic video feeds. This fully remote approach also allows for data collection without deploying humans in the field providing not only labor cost savings, but also a safe alternative during public health crises in which disease spread is a concern.
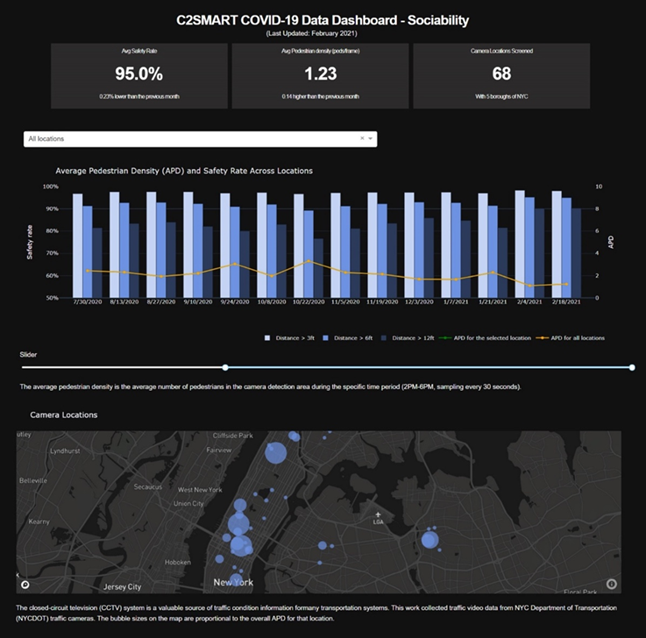
Building an Interactive Data Visualization Dashboard
The sample traffic camera footage and resulting social distancing and pedestrian density data are displayed on an all-in-one data dashboard built with interactive analytics and visualization (Figure 5) [9]. The dashboard supports scenario analyses with different performance metrics in time series by location to understand the temporal and spatial aspects of the data. This platform is updated regularly and continues to evolve with the addition of new data, metrics, and visualizations.
Lessons Learned
The following considerations could help when developing and deploying computer vision-based data collection applications, especially for pedestrian detection:
- Utilize existing transportation infrastructure and ITS devices (e.g., CCTV cameras) to minimize deployment cost when designing a computer vision-based data collection application.
- Develop an expandable framework to accommodate potential future needs of new features or add-ons to the current system.
- Engage with local partners to ensure relevant agencies and stakeholders can use the data and its findings to adapt policy interventions and outreach.
- Account for privacy when designing a computer vision-based application for pedestrian detection. Masks, blur filters, and reduced image resolution can be useful, simple solutions for protection of personal identities.
- Low resolution and frame rate cameras are sufficient to provide pedestrian density information with appropriate pre- and post-processing filters and existing computer vision techniques.
- Emerging technologies, such as AI-based automated detection, can be useful for short-term before-after evaluations since they can reduce the time and effort associated with manual data collection.
- Remote data collection and reference-free distance approximation techniques can improve flexibility, reduce labor costs, and minimize the dangers of fieldwork (e.g., during a pandemic) , as human investigators are not required.
- Detection accuracy largely depends on the resolution, sampling rate, and angle of the camera as well as the training image set. The detection model can be retrained using localized annotated images to improve performance.
- Cloud-based server and storage service is cheaper in the short-term (i.e., less than 5 years) when compared with local server and storage [7]. However, data archiving needs to be considered if cloud-based server and storage service is used for the long term.
- Local server storage is a good option for testing or piloting a video detection system. It is easy to set up but may suffer from single point failure (i.e., when the server is down, there is no incoming data, and data cannot be retrieved before it is restarted). To avoid this, a backup local server is needed, which may double the server acquisition cost.
References
[1] P. Ryus et al., "NCHRP Report 797: Guidebook on Pedestrian and Bicycle Volume Data Collection," 2014.
[2] U. S. University Transportation Centers (UTC) Programs. "Using Video Feeds from Public Traffic Cameras and Computer Vision to Analyze Social Distancing and Travel Patterns during the COVID-19 Pandemic." https://www.transportation.gov/utc/using-video-feeds-public-traffic-cameras-and-computer-vision-analyze-social-distancing-and (accessed November 11, 2021).
[3] M. Pourhomayoun, "Automatic Traffic Monitoring and Management for Pedestrian and Cyclist Safety Using Deep Learning and Artificial Intelligence," 2020.
[4] M. K. Kocamaz, J. Gong, and B. R. Pires, "Vision-based Counting of Pedestrians and Cyclists," in 2016 IEEE winter conference on applications of computer vision (WACV), 2016: IEEE, pp. 1-8.
[5] NYSDOT. "Intelligent Transportation Systems (ITS)." https://www.dot.ny.gov/divisions/operating/oom/transportation-systems/systems-optimization-section/ny-moves/traffic-cameras (accessed August 12, 2021).
[6] F. Zuo, J. Gao, A. Kurkcu, H. Yang, K. Ozbay, and Q. Ma, "Reference-free Video-to-real Distance Approximation-based Urban Social Distancing Analytics Amid COVID-19 Pandemic," Journal of Transport & Health, vol. 21, p. 101032, 2021, doi: https://doi.org/10.1016/j.jth.2021.101032.
[7] C2SMART. "Reference-Free Video-to-Real Distance Approximation-Based Pedestrian Detection System Amid COVID-19 Pandemic." /node/209597 (accessed August 12, 2021).
[8] The U.S. Department of Transportation ITS Joint Program Office. "2020 ITS Deployment Tracking Survey (DTS)." www.itskrs.its.dot.gov/deployment/2020DTS (accessed Feb 14, 2022).
[9] C2SMART. "COVID-19 Data Dashboard." https://c2smart.engineering.nyu.edu/covid-19-dashboard (accessed August 12, 2021).


